
Instroduction
You could need to make chart based application on pure java GUI, Use this library. Also when you need to build dashboard on non-web-based java application, Just use Chaosgraph library. Maybe when if you are working with Eclipse RCP to make analysis app or CRM, MIS, This library could successful choice for your project's goal as UX to users. This library's core is java. Nevertheless, if you use Eclipse RAP, you can make a chart on Web Browser.
Github: https://github.com/9ins/chaosgraph/
Download jar: https://github.com/9ins/chaosgraph/tree/master/build/libs/chaosgraph-2.0.0.jar
Maven dependency
<!-- https://mvnrepository.com/artifact/io.github.9ins/chaosgraph -->
<dependency>
    <groupId>io.github.9ins</groupId>
    <artifactId>chaosgraph</artifactId>
    <version>2.0.0</version>
</dependency>
Gradle dependency
// https://mvnrepository.com/artifact/io.github.9ins/chaosgraph
implementation group: 'io.github.9ins', name: 'chaosgraph', version: '2.0.0'
Examples AWT/SWT
- https://github.com/9ins/chaosgraph/blob/master/src/main/java/org/chaostocosmos/chaosgraph/awt2d/AWTGraphSimple1.java
- https://github.com/9ins/chaosgraph/blob/master/src/main/java/org/chaostocosmos/chaosgraph/awt2d/AWTGraphSimple2.java
- https://github.com/9ins/chaosgraph/blob/master/src/main/java/org/chaostocosmos/chaosgraph/swt2d/SWTGraphSimple.java
How to code
To make a chart on your App, follow below steps.
If you visit the Github page, Can get more information. e.g. Examples of a chart.
- You need JRE over 1.8 or more.
- Download Jar file on above link.
- Add [GRAPH_HOME]/build/libs/chaosgraph-2.0.0.jar to classpath on your project.
- Create code defining indexes of x, y axis.
    List<Object> xIndex = new ArrayList<Object>();
    List<Double> yIndex = new ArrayList<Double>();
    xIndex.add("Jan");
    xIndex.add("Feb");
    xIndex.add("Mar");
    xIndex.add("Apr");
    xIndex.add("May");
    xIndex.add("Jun");
    xIndex.add("Jul");
    xIndex.add("Aug");
    xIndex.add("Seb");
    xIndex.add("Oct");
    xIndex.add("Nov");
    xIndex.add("Dec");
    yIndex.add(1024d*1024d*100d);
    yIndex.add(1024d*1024d*500d);
    yIndex.add(1024d*1024d*1000d);
    yIndex.add(1024d*1024d*5000d);
- Create GraphElements object with x, y indexes.
GraphElements graphElements = new GraphElements(GRAPH.AREA, xIndex, yIndex);
- Add GraphElement objects being created to GraphElements object created above.
    double[] values = {1024d*1024d*45d, 1024d*1024d*55d, 1024d*1024d*3d, 1024d*1024d*66d, 1024d*1024d*33d, 1024d*1024d*6d, 1024d*1024d*9d, 1024d*1024d*600d, 1024d*1024d* 500d, 1024d*1024d*980d, 1024d*1024d*103d, 1024d*1024d*666d}
    GraphElement ge = new GraphElement("Kafka", Color.GRAY, values);
    graphElements.add(ge);
    .... (could be added more elements)
- Create GraphPanel object with pre-created GraphElements object.
    //Area graph type with width 600 pixel, height 400 pixel
    GraphPanel gpArea = new GraphPanel(GRAPH.AREA, graphElements, 600, 400);
- To setting proper or wanted option at Graph object retrived from GraphPanel object.
    AbstractGraph graph = (AreaGraph)gpArea.getGraph();
    graph.setTitle("This is simple area graph.");
    graph.setShowShadow(false);
    graph.setGridStyle(GRID.DOT);
    graph.setLimit(1000);
    graph.setPopupStyle(POPUP_STYLE.ROUND);
    graph.setSelectionEnable(true);
    graph.setSelectionBorder(SELECTION_BORDER.DOT);
    graph.setShowGraphXY(false);
- Add GraphPanel object to be required target UI component.
    getContentPane().add(gpArea , BorderLayout.CENTER);
    getContentPane().validate();
    gpArea .repaint();
For more information, visit Github wiki : https://github.com/9ins/chaosgraph/wiki
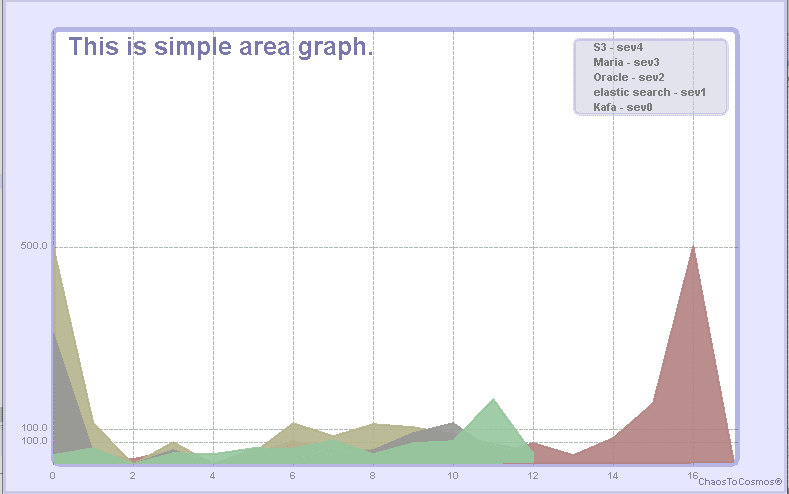
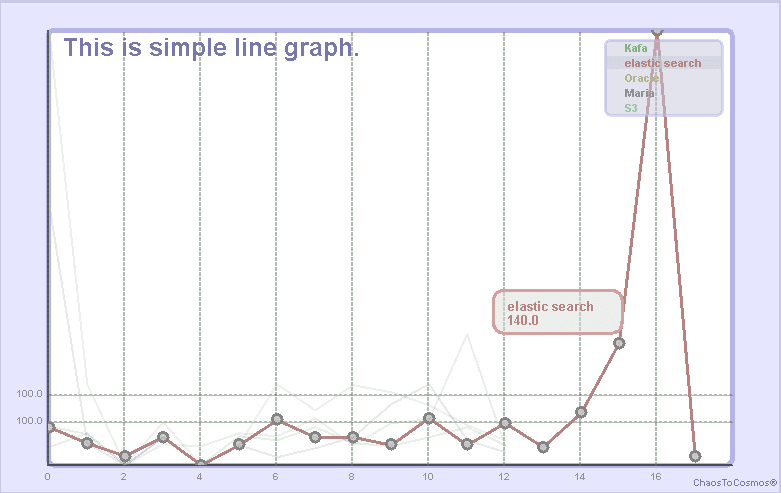
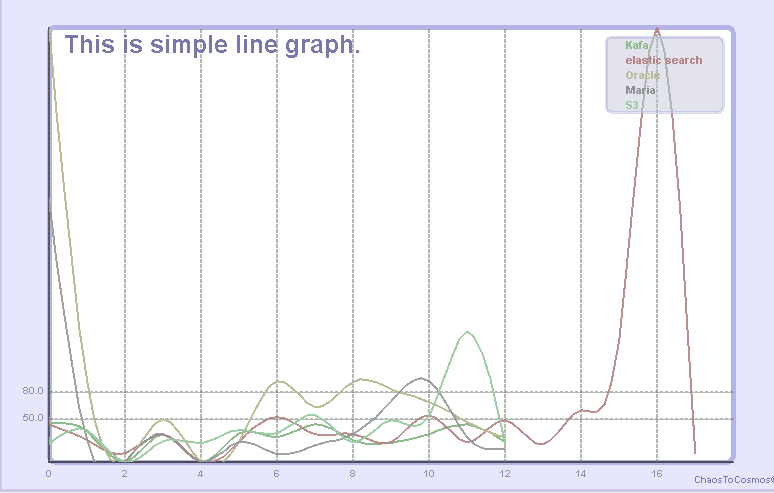
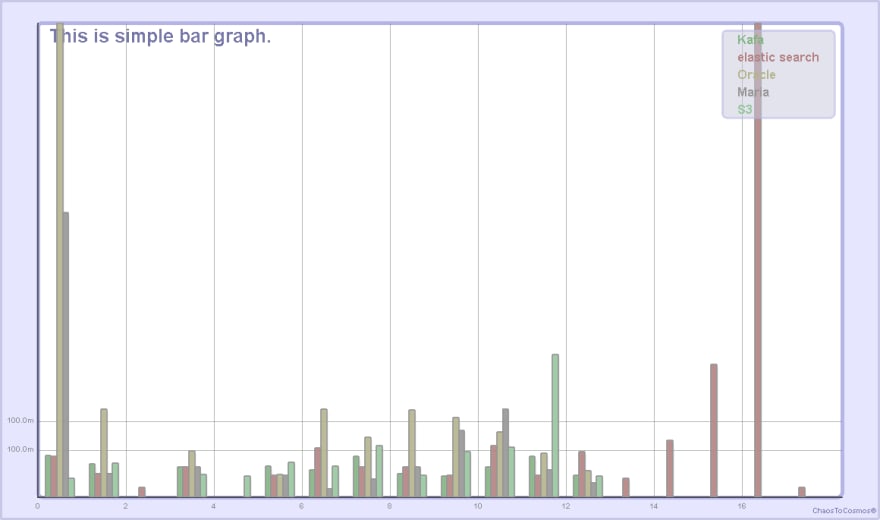
Sample images
Area chart
Line chart
Line chart applied with interpolation
Bar chart
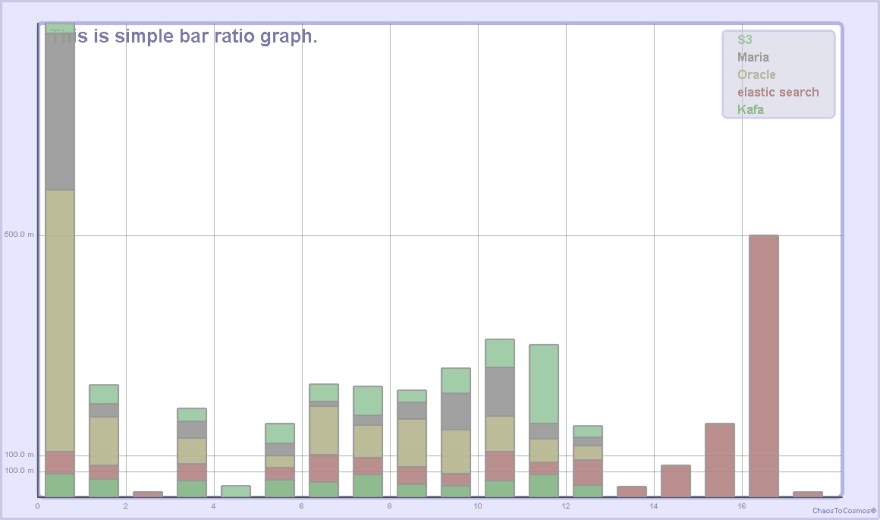
Bar Ratio chart
Circle chart


Top comments (0)