
I would greatly appreciate it if you kindly give me some feedback on this
part 2 is here 💥💥
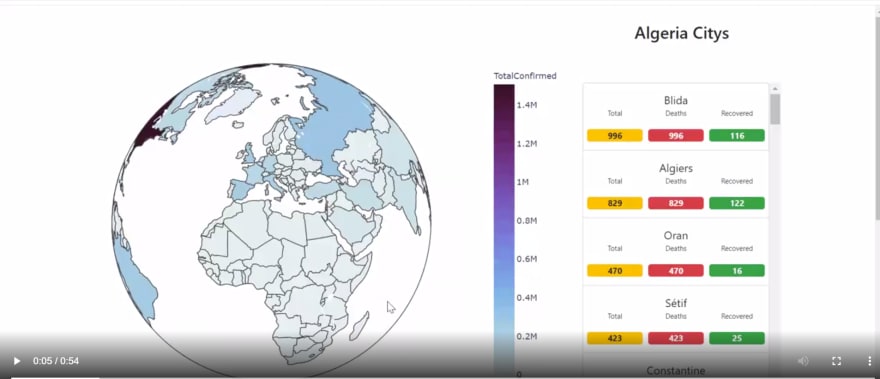
in this post will show how to create a simple dashboard to follow the progress of the covid19🚑 virus and its spread
our app will look like this in the end 😀😀
Dash :
Dash is Python web framework for building analytical web application , wich use flask on the server side , react for the front end ,and plotly.js for the data visualisation
if you want learn more about dash
check the this post on data camp
and you know Truth can only be found in one place: the code so lets start coding

Coding part 💻
setup our dash app 🚩
install dash and plotly and pondas by typing
pip install dash dash-renderer dash-html-components dash-core-components plotly pandas
then lets create a directory for our project and name it ** covid19Dash **
mkdir covid19Dash && cd covid19Dash
inside this directory create app.py file
touch app.py
and add this code to it
#covid19Dash/app.py
#dash imports
import dash
import dash_core_components as dcc
import dash_html_components as html
#end of dash imports

##  HTML code ##
app.layout = html.Div(children=[ "hello there"])
### end of HTML ##

#init the app and server
app = dash.Dash()
server = app.server
now run
python app.py
and check this link http://127.0.0.1:8050/ if everything is running fine lets move to the next part
🧭 we need to create another python file with name of data.py this files will container logic about how to extract and use our data
touch data.py
inside the data.py file lets define a function to extract data from APIs with three arguments api_url , field and the name of the csv file file_name that contains the data
#covid19Dash/data.py

# don't forget to import this
import pandas as pd
import json
import requests
######


def get_api_data(api_url, field_name, file_name):
    data = requests.get(api_url)
    results = pd.DataFrame(data.json()[field_name])

    #save the result in the data folder
    results.to_csv('data/'+file_name+'.csv', sep=',' )

    # return API data
    return results
to get the data we are using 2 APIs
the first one covid19api containe data about the countries total cases , new cases, total deaths , .... and more
the second one trackcorona containe data about the citys in each country (total cases, total deaths , total recovered)
now lets get and save the data add this lines of code to data.py
#covid19Dash/data.py
### get countries data
get_api_data(
        'https://api.covid19api.com/summary', # API link
        'Countries', #field name
        'countries', #file name
)
by running python data.py our countries.csv file will look like this one below
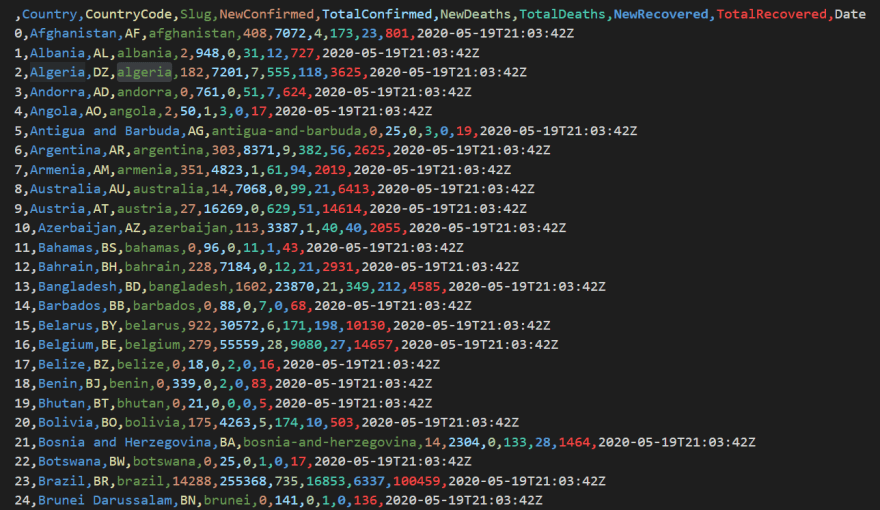
😎 lets visualize the data we need to create a new file charts.py , add this lines to it
#covid19Dash/charts.py
#librarys
import json
#plotly and dash
import plotly.express as px
define a viz_earth_data function which is going to get countries data from our csv file and plot it on choropleth
#covid19Dash/charts.py
def viz_earth_data(df=open_csv("data/countries.csv")):

    fig = px.choropleth( df, locations="Country",
                        color="TotalConfirmed",
                        hover_name="Country",
                        hover_data=[ 'CountryCode',
                            'NewConfirmed','TotalConfirmed',
                            'NewDeaths','TotalDeaths','NewRecovered',
                            'TotalRecovered','Date', 'Slug'
                                   ],
                        locationmode="country names",
                        projection="orthographic",
                        color_continuous_scale=px.colors.sequential.dense,
                        height=600

                       ).update_layout(clickmode='event+select')


    return fig
now lets go back to our app.py and import the viz_earth_data function
from charts import viz_earth_data
after this add the graph to our HTML layout
app.layout = html.Div(children=[
     dcc.Graph(
            id='earth-graph', #graph id
            figure = viz_earth_data() , #this will show the earth graph
            config={
              'displayModeBar': False
            }
        ),
])
now run python app.py and open http://127.0.0.1:8050/ in your browser , you will see something like this


Top comments (0)