
AWS Lambda is a go-to compute service for many serverless developers. Powerful and flexible, it allows for arbitrary code execution in various programming languages. The service is not all sunshine and rainbows – things tend to fail. And when they do, it is crucial to have visibility into what happened.
A popular choice of gaining visibility into the AWS Lambda execution cycle is logging. When implemented with care, it can save you hours of debugging time, but it is a double-edged sword. The more you log, the more you will pay for Amazon CloudWatch Logs.
So how to eat the cake and have it too? How can we ensure that our logs are sufficient to help us debug potential AWS Lambda issues while still keeping our costs down?
This blog post will showcase one technique I'm aware of that, in my personal opinion, works excellent for this particular use case.
Let us begin.
All the code in this blog post is written in TypeScript. Treat the code snippets as pseudo-code rather than actual implementation.
The problem with the extremes
One mistake that, in my experience, developers tend to make is to reach for extremes – either logging everything or not logging at all. Both scenarios are problematic from an operational perspective.

Logging every action undoubtedly gives you this warm fuzzy feeling of comfort that if something were to happen, you have every piece of context right in front of you. Hopefully, this gives you the ability to pinpoint any potential issues fast and resolve them in no time.
The problem with this approach is that your Amazon CloudWatch bill will most likely be huge (relative to other services you use). I've seen serverless applications where Amazon CloudWatch contributed to 80% of the AWS bill. Not ideal.
Not having any logs in place or logging very little can also have devastating effects. This time, it is not about the AWS CloudWatch costs but the potential time it takes to debug an issue within the AWS Lambda function. Every error turns into a murder mystery with hours of resolution time. Not ideal.
In the ideal world, we could log the bare minimum when everything is fine but have very verbose logs when an error occurred. It turns out the "ideal world" is within reach and, in my personal experience, works great for most AWS Lambda functions, no matter the programming language.
The technique
The way we could achieve the logging nirvana I eluded to earlier is surprisingly not that complex (maybe I overlooked something? If so, please let me know!).
The basic idea is as follows:
- Use your logger of choice as you were before.
- The
log.debugcalls, by default, will not be pushed to STDOUT. Instead, we will keep them in memory. - The
log.infocalls will be pushed to STDOUT. - Whenever an error happens, in our case followed by a
log.errorcall, the logger releases alllog.debugmessages, along with thelog.errormessage.

With this setup in place, If the execution of an AWS Lambda function was successful, we only pay for the log.info (and other, all depends on your setup) data. Conversely, if something blows up, we get all the context we need to debug the execution.
Now, onto the implementation.
The implementation
Here is a very contrived example of an AWS Lambda function.
import { APIGatewayProxyEvent, APIGatewayProxyHandler } from "aws-lambda";

export const handler: APIGatewayProxyHandler = async event => {
  try {
    const data = await performWork(event);
    const result = await performOtherWork(data);

    return {
      statusCode: 200,
      body: JSON.stringify(result)
    };
  } catch (e) {
    return {
      statusCode: 500,
      message: "Something blew up!"
    };
  }
};

async function performWork(event: APIGatewayProxyEvent) {
  // implementation...
}

async function performOtherWork(data: unknown) {
  // implementation...
}
The code is not instrumented in any shape or form. Let us change that by adding logging.
import { APIGatewayProxyEvent, APIGatewayProxyHandler } from "aws-lambda";
+ import { log } from './logger'

import { APIGatewayProxyEvent, APIGatewayProxyHandler } from "aws-lambda";

export const handler: APIGatewayProxyHandler = async event => {
+ log.info("event", event);
  try {
    const data = await performWork(event);
    const result = await performOtherWork(data);

+ log.info("response", {...})
    return {
      statusCode: 200,
      body: JSON.stringify(result)
    };
  } catch (e) {
+ log.error("error!", e)

    return {
      statusCode: 500,
      message: "Something blew up!"
    };
  }
};

async function performWork(event: APIGatewayProxyEvent) {
+ log.debug("entering performWork", event)
  // implementation...
+ log.debug("exiting performWork", {...})
}

async function performOtherWork(data: unknown) {
+ log.debug("entering performOtherWork", data)
  // implementation...
+ log.debug("exiting performOtherWork", {...})
}
I've added quite a generous amount of logging to our code.
Keep in mind that this example is only for demonstrational purposes. You would most likely have a logging middleware that logs parts of the request and response in the real world.
If we were to allow every log.X call to push to STDOUT, given high-enough traffic, our Amazon CloudWatch bill might be pretty high.
There are many dimensions when it comes to Amazon CloudWatch Logs pricing. One of them is the size of the log messages, which I'm not concerned about in the example. Check out the Amazon CloudWatch pricing page for more details.
But our logger has a twist I've talked about earlier. The log.debug calls will NOT be pushed to STDOUT by default. Here is a contrived implementation of the logger.
// logger.ts
export const log = {
  debugCallsBuffer: [] as (() => void)[],
  info(message: string, ...args: any[]) {
    console.log(message, ...args);
  },
  error(message: string, ...args: any[]) {
    console.error(message, ...args);

    console.log("Debug buffer");

    this.debugCallsBuffer.forEach(debugLogCall => debugLogCall());
  },
  debug(message: string, ...args: any[]) {
    this.debugCallsBuffer.push(() => console.debug(message, ...args));
  }
};
The log object methods are facades over various console methods. Instead of calling console.debug eagerly, the debug function pushes a function to the debugCallsBuffer array. When we call the error function, the debugCallsBuffer is "flushed".
You most likely use a third-party package for logging in your day-to-day work to ensure that the log messages you produce are structured. Nevertheless, the idea still stands.
Neat! Now you can write log.debug statements to your heart's content without the fear of logging a massive blob of data for every AWS Lambda function execution.
We need to think about two more things before we start using the log object for our logging.
- How do we "flush" the
debugCallsBufferwhen AWS Lambda executes successfully – otherwise, we run a risk of logging debug messages from previous AWS Lambda executions! - How do we "flush" the
debugCallsBufferwhenever your AWS Lambda is about to timeout.
Flushing after successful AWS Lambda execution
If you read the documentation for AWS Lambda execution environment, you will learn about the concepts of execution environment re-use, freezing and unfreezing the execution environment. These concepts are necessary to understand the WHY behind this section, so consider giving it a read if you have not already.
If AWS Lambda service did not re-use the execution environments, we would not have been to cache at the AWS Lambda runtime level. For more information regarding caching at the AWS Lambda runtime level, consider reading this article or this article.
The following is a visual representation of the problem we are trying to solve in this section.
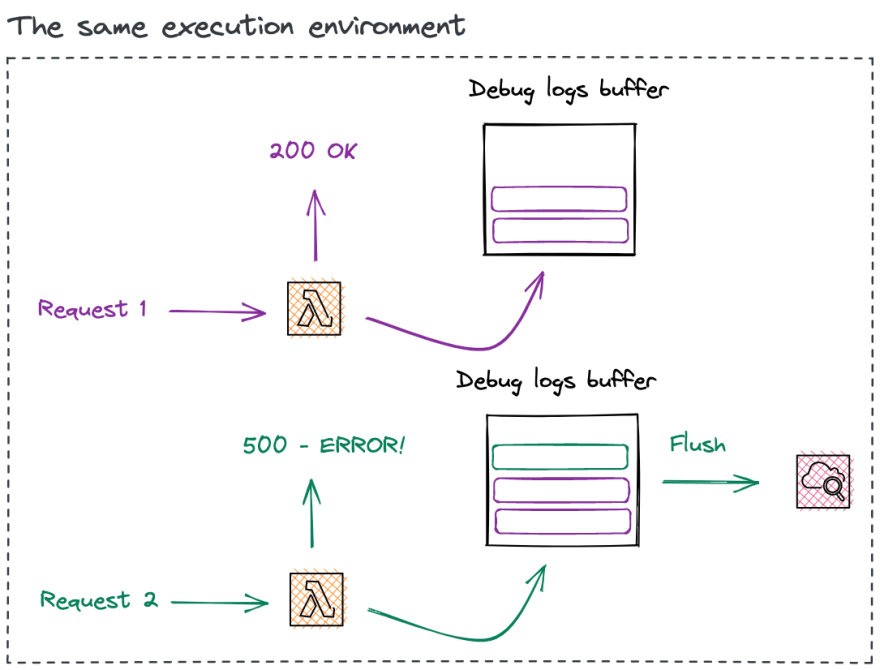
If we do not clear the debugCallsBuffer when AWS Lambda succeeds, we might log debug messages from the previous execution if it errors!. Not ideal.
The solution to the problem is very implementation-specific. Adding a clear function for our contrived logger example will do.
// logger.ts

export const log = {
  debugCallsBuffer: [] as (() => void)[],
  info(message: string, ...args: any[]) {
    console.log(message, ...args);
  },
  error(message: string, ...args: any[]) {
    console.error(message, ...args);

    console.log("Debug buffer");

    this.debugCallsBuffer.forEach(debugLogCall => debugLogCall());
  },
  debug(message: string, ...args: any[]) {
    this.debugCallsBuffer.push(() => console.debug(message, ...args));
  },
+ clear() {
+   this.debugCallsBuffer = []
+ }
};
And within our AWS Lambda handler code...
import { APIGatewayProxyEvent, APIGatewayProxyHandler } from "aws-lambda";
import { log } from './logger'

import { APIGatewayProxyEvent, APIGatewayProxyHandler } from "aws-lambda";

export const handler: APIGatewayProxyHandler = async event => {
 log.info("event", event);
  try {
    const data = await performWork(event);
    const result = await performOtherWork(data);

 log.info("response", {...})
    return {
      statusCode: 200,
      body: JSON.stringify(result)
    };
  } catch (e) {
 log.error("error!", e)

    return {
      statusCode: 500,
      message: "Something blew up!"
    };
+ } finally {
+   log.clear();
+ }
};
Again, the code is very contrived, but the point still stands. If you do not "clear" the buffer after every execution, you might see weird logs in the AWS CloudWatch logs console.
Flushing before AWS Lambda timeout
AWS Lambda is a time-bounded compute service. The maximum duration the AWS Lambda function can run for, at the time of writing this article, is 15 minutes. This setting is, of course, configurable.
If you are using a framework to deploy and develop your serverless applications (which, in my humble opinion, you should), the framework you use might set a default function timeout for you. Be aware of that.
I would argue that if my AWS Lambda function is about to timeout, it would be wise to release all the logs from the debugCallsBuffer. The function timeout will result in an error. If the function is frontend with Amazon API Gateway, the Amazon API Gateway will return a 500 status code to the caller (unless you have configured it to do otherwise). With all the logs available to me, I would likely have a higher chance of fixing the timeout issues.
To know whether our AWS Lambda function is about to timeout, we could use the getRemainingTimeInMillis function retrieved from the context that the service passes to our AWS Lambda function. Here is a sample implementation of logging an error (in turn releasing the debug logs) just before AWS Lambda is about to timeout.
import {
  APIGatewayProxyEvent,
  APIGatewayProxyHandler,
  Context
} from "aws-lambda";
import { log } from "./logger";

const logBeforeTimeout = (context: Context) => {
  const deadline = context.getRemainingTimeInMillis() - 100;
  const timeoutId = setTimeout(() => {
    log.error("About to timeout");
  }, deadline);

  return () => clearTimeout(timeoutId);
};

export const handler: APIGatewayProxyHandler = async (event, context) => {
  const cleanup = logBeforeTimeout(context);

  try {
    const result = await performWork(event);

    return {
      statusCode: 200,
      body: JSON.stringify(result)
    };
  } catch (e) {
    return {
      statusCode: 500,
      message: "Something blew up!"
    };
  } finally {
    cleanup();
  }
};

async function performWork(event: APIGatewayProxyEvent) {
  // implementation...
}
The logBeforeTimeout function starts a timer and logs an error before the deadline. It is essential to clear the timer no matter if the execution was successful or not. If you do not, you are asking for a memory leak to happen!
Small note for the Node.js users out there. It is entirely possible for the
setTimeoutnever to run at all. If the Node.js event loop is blocked (think an infinite loop somewhere in your code), your timer will never run. One of the solutions I'm aware of is to run the timer in a separate thread.
Closing words
There you have it. This is how to have low AWS CloudWatch Logs costs and have every log line available to you when an issue occurs. This blog was heavy on the theory side since I wanted to relay an idea (which I believe is language-agnostic) rather than a specific implementation.
What do you think of this approach? Is it a bad idea? Maybe you have other solutions in mind? I'm always happy to hear your thoughts and opinions.
For more serverless content, consider following me on Twitter - @wm_matuszewski.
Thank you for your valuable time. Have a great day 👋.


Top comments (5)
It's a good idea and exactly why I build
lesslogsome time ago: npmjs.com/package/lesslogIf you are using
middyit even comes with a dedicated middleware: npmjs.com/package/middy-lesslogFeel free to check it out. I'd be happy for any feedback :)
Neat! Thank you for sharing.
Really interesting approach, usually I've used log sampling to have log level in production set to ERROR or INFO and then automatically log say 5% of the DEBUG statements.
ref: getndazn.github.io/dazn-lambda-pow...
Awesome! Thanks for sharing!!
You can use Serverless Observability tools for convenience and saving time.