
Cube.js is an open source framework for building analytical web applications. It is primarily used to build internal business intelligence tools or to add customer-facing analytics to an existing application. In a majority of cases, the first step of building such an application is an analytics dashboard. It usually starts with—“let’s add an analytics dashboard to our admin panel.” Then, as it always happens in software development, things get more complicated, much more complicated.
When we started working on Cube.js, we wanted to build a tool, which is simple to start but scales easily in features, complexity, and data volume. Cube.js puts down a solid foundation for your future analytical system, whether it is a standalone application or embedded into the existing one.
You can think about this tutorial as “Cube.js 101.” I’ll walk you through the basic steps of designing the first dashboard from the database to visualizations.
The live demo of the final dashboard is available here. The full source code is on Github.
Architecture
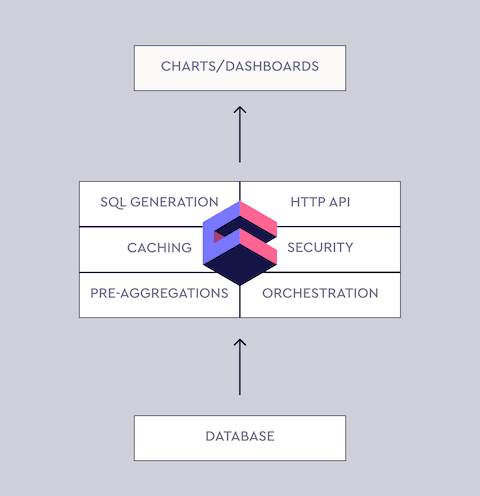
The majority of modern web applications are built as a single-page application, where the frontend is separated from the backend. The backend also usually is split into multiple services, following a microservice architecture.
Cube.js embraces this approach. Conventionally you run Cube.js Backend as a service. It manages the connection to your database, including queries queue, caching, pre-aggregation, and more. It also exposes an API for your frontend app to build dashboards and other analytics features.
Backend
Analytics starts with the data and data resides in a database. That is the first thing we need to have in place. You most likely already have a database for your application and usually, it is just fine to use for analytics. Modern popular databases such as Postgres or MySQL are well suited for a simple analytical workload. By simple, I mean a data volume with less than 1 billion rows.
MongoDB is fine as well, the only thing you’ll need to add is MongoDB Connector for BI. It allows executing SQL code on top of your MongoDB data. It is free and can be easily downloaded from the MongoDB website. One more thing to keep in mind is replication. It is considered a bad practice to run analytics queries against your production database mostly because of the performance issues. Cube.js can dramatically reduce the amount of a database’s workload, but still, I’d recommend connecting to the replica.
To summarize—
If you use Postgres or MySQL, just create a replica and we’re good to go. If you use MongoDB—download MongoDB Connector for BI and create a replica.
If you don’t have any data for the dashboard, you can load our sample e-commerce Postgres dataset.
$ curl http://cube.dev/downloads/ecom-dump.sql > ecom-dump.sql
$ createdb ecom
$ psql --dbname ecom -f ecom-dump.sql
Now, as we have data in the database, we’re ready to create the Cube.js Backend service. Run the following commands in your terminal:
$ npm install -g cubejs-cli
$ cubejs create dashboard-backend -d postgres
The commands above install Cube.js CLI and create a new service, configured to work with Postgres database.
Cube.js uses environment variables for configuration. It uses environment variables starting with CUBEJS_. To configure the connection to our database, we need to specify the DB type and name. In the Cube.js project folder replace the contents of .env with the following:
CUBEJS_API_SECRET=SECRET
CUBEJS_DB_TYPE=postgres
CUBEJS_DB_NAME=ecom
Cube.js Data Schema
The next step is to create a Cube.js data schema. Cube.js uses the data schema to generate an SQL code, which will be executed in your database. The data schema is not a replacement for SQL. It is designed to make SQL reusable and give it a structure while preserving all of its power. Basic elements of the data schema are measures and dimensions.
Measure is referred to as quantitative data, such as the number of units sold, number of unique visits, profit, and so on.
Dimension is referred to as categorical data, such as state, gender, product name, or units of time (e.g., day, week, month).
Conventionally, schema files are located in the schema folder. Here is an example of the schema, which can be used to describe users’ data.
cube(`Users`, {
  sql: `SELECT * FROM users`,

  measures: {
    count: {
      sql: `id`,
      type: `count`
    }
  },

  dimensions: {
    city: {
      sql: `city`,
      type: `string`
    },

    signedUp: {
      sql: `created_at`,
      type: `time`
    },

    companyName: {
      sql: `company_name`,
      type: `string`
    }
  }
});
Now, with the above schema in place, we can send queries to the Cube.js backend about users’ data. Cube.js queries are plain javascript objects. Usually it has one or more measures, dimensions, and timeDimensions.
If we want to answer the question “Where are our users based?” we can send the following query to the Cube.js:
{
   measures: ['Users.count'],
   dimensions: ['Users.city']
}
Cube.js will generate the required SQL based on the schema, execute it, and send the result back.
Let’s create a slightly more complicated query. We can add a timeDimensions to see how the ratio of different cities has been changing every month during the last year. To do this, we will add a signedUp time dimension, group it by monthly, and filter only last year’s signups.
{
   measures: ['Users.count'],
   dimensions: ['Users.city'],
   timeDimensions: [{
     dimension: 'Users.signedUp',
     granularity: 'month',
     dateRange: ['2018-01-31', '2018-12-31']
   }]
}
Cube.js can generate simple schemas based on your database’s tables. Let’s generate schemas we need for our dashboard and then start a dev server.
$ cubejs generate -t users,orders
$ npm run dev
You can inspect generated schemas and send test queries by opening a development playground at http://localhost:4000.
Frontend
We’ll build our frontend and dashboard with React, using the Cube.js React client. But you can use any framework or just vanilla javascript to build a frontend with Cube.js. This tutorial shows you how to build a dashboard in pure javascript.
We’ll set everything up using Create React App, which is officially supported by the React team. It packages all the dependencies for React app and makes it easy to get started with a new project. Run the following commands in your terminal:
$ npx create-react-app dashboard-frontend
$ cd cubejs-dashboard
$ npm start
The last line starts a server on port 3000 and opens your web browser at http://localhost:3000.
We’ll build our UI with Reactstrap, which is a React wrapper for Bootstrap 4. Install Reactstrap and Bootstrap from NPM. Reactstrap does not include Bootstrap CSS, so this needs to be installed separately:
$ npm install reactstrap bootstrap --save
Import Bootstrap CSS in the src/index.js file before importing ./index.css:
import 'bootstrap/dist/css/bootstrap.min.css';
Now we are ready to use the Reactstrap components.
The next step is to install Cube.js client to fetch the data from the server and our visualization library to display it. For this tutorial, we’re going to use Recharts. Cube.js is visualization agnostic, meaning you can use any library you want. We’ll also use moment and numeral to nicely format dates and numbers.
$ npm install --save @cubejs-client/core @cubejs-client/react recharts moment numeral
Finally, we’re done with dependencies, so let’s go ahead and create our first chart.
Replace the contents of src/App.js with the following:
import React, { Component } from "react";
import {
 BarChart,
 Bar,
 XAxis,
 YAxis,
 Tooltip,
 ResponsiveContainer
} from "recharts";
import cubejs from "@cubejs-client/core";
import moment from "moment";
import { QueryRenderer } from "@cubejs-client/react";

const cubejsApi = cubejs(process.env.REACT_APP_CUBEJS_TOKEN, {
 apiUrl: process.env.REACT_APP_API_URL
});

const dateFormatter = item => moment(item).format("MMM YY");

class App extends Component {
 render() {
   return (
     <QueryRenderer
       query={{
         measures: ["Orders.count"],
         timeDimensions: [
           {
             dimension: "Orders.createdAt",
             dateRange: ["2017-01-01", "2018-12-31"],
             granularity: "month"
           }
         ]
       }}
       cubejsApi={cubejsApi}
       render={({ resultSet }) => {
         if (!resultSet) {
           return "Loading...";
         }

         return (
           <ResponsiveContainer width="100%" height={300}>
             <BarChart data={resultSet.chartPivot()}>
               <XAxis dataKey="x" tickFormatter={dateFormatter} />
               <YAxis />
               <Tooltip labelFormatter={dateFormatter} />
               <Bar dataKey="Orders.count" fill="rgba(106, 110, 229)" />
             </BarChart>
           </ResponsiveContainer>
         );
       }}
     />
   );
 }
}

export default App;
You can check out this example in the CodeSandbox below.
Let’s look deeper at how we load data and draw the chart.
First, we’re initializing the Cube.js API client:
const cubejsApi = cubejs(process.env.REACT_APP_CUBEJS_TOKEN, {
 apiUrl: process.env.REACT_APP_API_URL
});
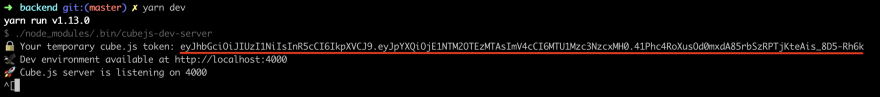
Here we are using the REACT_APP_CUBEJS_TOKEN and REACT_APP_API_URL environment variables. Create React App automatically loads your env variables from the .env file if they start with REACT_APP_. The Cube.js backend will print the development API token during the startup.
Create a .env file with the correct credentials.
REACT_APP_CUBEJS_TOKEN=COPY-API-TOKEN-FROM-TERMINAL-OUTPUT
REACT_APP_API_URL=http://localhost:4000/cubejs-api/v1
Next, we are using the QueryRenderer Cube.js React Component to load Orders data.
<QueryRenderer
  query={{
    measures: ["Orders.count"],
    timeDimensions: [
      {
        dimension: "Orders.createdAt",
        dateRange: ["2017-01-01", "2018-12-31"],
        granularity: "month"
      }
    ]
  }}
  cubejsApi={cubejsApi}
  render={({ resultSet }) => {
    // Render result
  }}
/>
QueryRenderer performs an API request to the Cube.js backend and uses the render props technique to let you render the result however you want to. We’ve already covered the query format above, but in case you want to refresh—here is the query format full reference.
The render parameter of QueryRenderer is a function of the type ({error, resultSet, isLoading}) => React.Node. The output of this function will be rendered by the QueryRenderer. A resultSet is an object containing data obtained from the query. If this object is not defined, it means that the data is still being fetched.
resultSet provides multiple methods for data manipulation, but in our case, we need just the chartPivot method, which returns data in a format expected by Recharts.
We’ll plot the Orders data as a bar chart inside a responsive container.
if (!resultSet) {
  return "Loading...";
}

return (
  <ResponsiveContainer width="100%" height={300}>
    <BarChart data={resultSet.chartPivot()}>
      <XAxis dataKey="x" tickFormatter={dateFormatter} />
      <YAxis />
      <Tooltip labelFormatter={dateFormatter} />
      <Bar dataKey="Orders.count" fill="rgba(106, 110, 229)" />
    </BarChart>
  </ResponsiveContainer>
);
Building a Dashboard
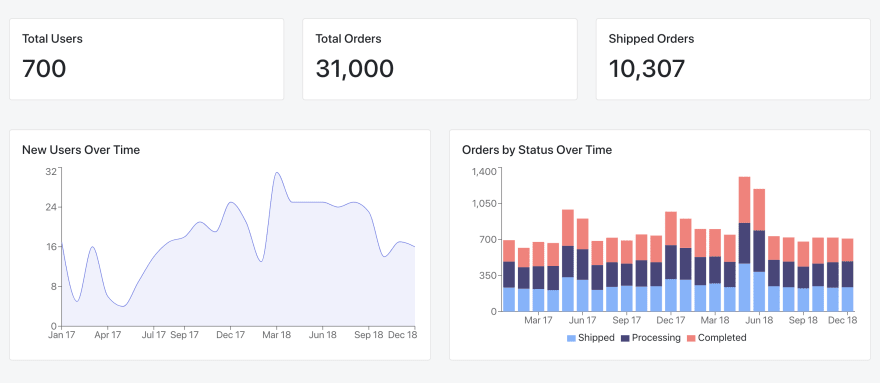
We learned how to build a single chart with Cube.js and Recharts, and we are now ready to start building the whole dashboard. There are some best practices regarding designing the layout of the dashboard. The common practice is to put the most important and high-level metrics on the top as single value charts, sometimes called KPIs, and then list the relevant breakdowns of those metrics.
Here is the screenshot of our final dashboard with KPIs on top followed by bar and line charts.
First, let’s refactor our chart and extract the common code into a reusable <Chart /> component. Create an src/Chart.js file the following content:
import React from "react";
import { Card, CardTitle, CardBody, CardText } from "reactstrap";
import { QueryRenderer } from "@cubejs-client/react";

const Chart = ({ cubejsApi, title, query, render }) => (
 <Card>
   <CardBody>
     <CardTitle tag="h5">{title}</CardTitle>
     <CardText>
       <QueryRenderer
         query={query}
         cubejsApi={cubejsApi}
         render={({ resultSet }) => {
           if (!resultSet) {
             return <div className="loader" />;
           }

           return render(resultSet);
         }}
       />
     </CardText>
   </CardBody>
 </Card>
);

export default Chart;
Next, let’s use this component to create the dashboard. Replace the content of src/App.js with the following:
import React, { Component } from "react";
import { Container, Row, Col } from "reactstrap";
import {
 AreaChart,
 Area,
 XAxis,
 YAxis,
 Tooltip,
 ResponsiveContainer,
 Legend,
 BarChart,
 Bar
} from "recharts";
import moment from "moment";
import numeral from "numeral";
import cubejs from "@cubejs-client/core";
import Chart from "./Chart.js";

const cubejsApi = cubejs(process.env.REACT_APP_CUBEJS_TOKEN, {
 apiUrl: process.env.REACT_APP_API_URL
});
const numberFormatter = item => numeral(item).format("0,0");
const dateFormatter = item => moment(item).format("MMM YY");

const renderSingleValue = (resultSet, key) => (
 <h1 height={300}>{numberFormatter(resultSet.chartPivot()[0][key])}</h1>
);

class App extends Component {
 render() {
   return (
     <Container fluid>
       <Row>
         <Col sm="4">
           <Chart
             cubejsApi={cubejsApi}
             title="Total Users"
             query={{ measures: ["Users.count"] }}
             render={resultSet => renderSingleValue(resultSet, "Users.count")}
           />
         </Col>
         <Col sm="4">
           <Chart
             cubejsApi={cubejsApi}
             title="Total Orders"
             query={{ measures: ["Orders.count"] }}
             render={resultSet => renderSingleValue(resultSet, "Orders.count")}
           />
         </Col>
         <Col sm="4">
           <Chart
             cubejsApi={cubejsApi}
             title="Shipped Orders"
             query={{
               measures: ["Orders.count"],
               filters: [
                 {
                   dimension: "Orders.status",
                   operator: "equals",
                   values: ["shipped"]
                 }
               ]
             }}
             render={resultSet => renderSingleValue(resultSet, "Orders.count")}
           />
         </Col>
       </Row>
       <br />
       <br />
       <Row>
         <Col sm="6">
           <Chart
             cubejsApi={cubejsApi}
             title="New Users Over Time"
             query={{
               measures: ["Users.count"],
               timeDimensions: [
                 {
                   dimension: "Users.createdAt",
                   dateRange: ["2017-01-01", "2018-12-31"],
                   granularity: "month"
                 }
               ]
             }}
             render={resultSet => (
               <ResponsiveContainer width="100%" height={300}>
                 <AreaChart data={resultSet.chartPivot()}>
                   <XAxis dataKey="category" tickFormatter={dateFormatter} />
                   <YAxis tickFormatter={numberFormatter} />
                   <Tooltip labelFormatter={dateFormatter} />
                   <Area
                     type="monotone"
                     dataKey="Users.count"
                     name="Users"
                     stroke="rgb(106, 110, 229)"
                     fill="rgba(106, 110, 229, .16)"
                   />
                 </AreaChart>
               </ResponsiveContainer>
             )}
           />
         </Col>
         <Col sm="6">
           <Chart
             cubejsApi={cubejsApi}
             title="Orders by Status Over time"
             query={{
               measures: ["Orders.count"],
               dimensions: ["Orders.status"],
               timeDimensions: [
                 {
                   dimension: "Orders.createdAt",
                   dateRange: ["2017-01-01", "2018-12-31"],
                   granularity: "month"
                 }
               ]
             }}
             render={resultSet => {
               return (
                 <ResponsiveContainer width="100%" height={300}>
                   <BarChart data={resultSet.chartPivot()}>
                     <XAxis tickFormatter={dateFormatter} dataKey="x" />
                     <YAxis tickFormatter={numberFormatter} />
                     <Bar
                       stackId="a"
                       dataKey="shipped, Orders.count"
                       name="Shipped"
                       fill="#7DB3FF"
                     />
                     <Bar
                       stackId="a"
                       dataKey="processing, Orders.count"
                       name="Processing"
                       fill="#49457B"
                     />
                     <Bar
                       stackId="a"
                       dataKey="completed, Orders.count"
                       name="Completed"
                       fill="#FF7C78"
                     />
                     <Legend />
                     <Tooltip />
                   </BarChart>
                 </ResponsiveContainer>
               );
             }}
           />
         </Col>
       </Row>
     </Container>
   );
 }
}

export default App;
That is enough to build our first dashboard. Give it a try in the CodeSanbox below.
Next Steps
We’ve built a simple proof of concept dashboard with Cube.js. You can check the live demo here. The full source code is available on Github.
To learn more about Cube.js backend deployment, you can refer to the deployment documentation. Also, here you can find more tutorials on a variety of topics.
And join our Slack Community! It is a great to place to get help and stay up to date with new releases.


Top comments (10)
hi,
issue with sql server connectivity.
can you share the sample code. here is my code
CUBEJS_DB_HOST=10.xx.1.xx
CUBEJS_DB_NAME=IT
CUBEJS_DB_PORT=1433
CUBEJS_DB_USER=sa
CUBEJS_DB_PASS=P@ssowrd
CUBEJS_DB_DOMAIN=yelahanka
CUBEJS_DB_TYPE=mssql
CUBEJS_API_SECRET=6417db1f8353aab399658cddcb073e6e988e340af6e7f0d6e0220ea17c6ff56542db53d0f0429fb522cf101f1a5ec452c5a2a47ae9a61bba8d05412dba610c97
This looks neat! I had never heard of cube.js before, but will definitely look deeper into it.
Thank you for the feedback!
Idem ! I never heard about cube.js but... i will put all of this in practice. Great tutorial!
Why prefer cube to a standard ready to use analytics like google's ?
i love open source... but what are the benefits of this DIY approach ?
thanks
There're a few benefits: first, you'll be able to use Cube.js API from within your app and build any data visualization you want; second, you're able to achieve unparalleled performance thanks to two-level chaching mechanism.
Can we pass parameters as start date -end date.
also, adding drop down list from db.
thanks in advance
How create interactive charts of dashboard using cube.js and SQL server
Can we add databases in cubejs?
Cube.js supports plenty of databases and data warehouses including Postgres, MySQL, BigQuery, Snowflake, etc. Please see the full list in docs. That being said, you can always create or propose a new driver, it's quite easy to support another SQL database.