This is an excerpt from the guide on building real-time dashboards with React and Cube.js. You can check the full guide here.
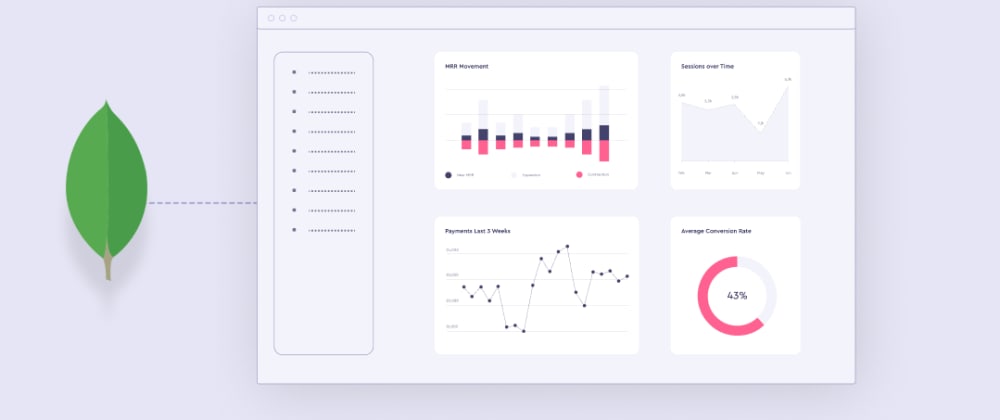
A real-time dashboard is a dashboard that contains charts that are automatically updated with the most current data available. The typical use case is to load a chart with some historical data first and then live update it as new data comes in. In this tutorial, you will learn how to build such real-time dashboards with only open-source tools and without any third-party services.
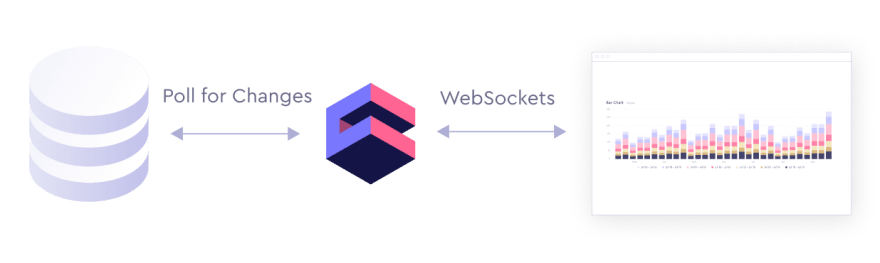
The main challenge of building such a dashboard is to design a proper architecture to react to changes in data all the way up from the database to the charts on the frontend. The part from the server to the frontend is a simple one, since we have a lot of technologies and frameworks built to handle real-time data updates. Going from database to server is much trickier. The underlying problem is that most of the databases, which are good for analytic workload, don't provide out-of-the-box ways to subscribe to changes in the data. Instead, they are designed to be polled.
Cube.js, which acts as a middleman between your database and analytics dashboard, can provide a real-time WebSockets-based API for the frontend, while polling the database for changes in data.
You can check out the demo of real-time dashboard built with Cube.js here.
On the frontend, Cube.js provides an API to load initial historical data and subscribe to all subsequent updates.
import cubejs from '@cubejs-client/core';
import WebSocketTransport from '@cubejs-client/ws-transport';

const cubejsApi = cubejs({
  transport: new WebSocketTransport({
    authorization: CUBEJS_TOKEN,
    apiUrl: 'ws://localhost:4000/'
  })
});

cubejsApi.subscribe({
  measures: ['Logs.count'],
  timeDimensions: [{
    dimension: 'Logs.time',
    granularity: 'hour',
    dateRange: 'last 1440 minutes'
  }]
}, (e, result) => {
  if (e) {
    // handle new error
  } else {
    // handle new result set
  }
});
In our tutorial, we are going to use React as a frontend framework. Cube.js has a @cubejs-client/react package, which provides React components for easy integration of Cube.js into the React app. It uses React hooks to load queries and subscribes for changes.
import { useCubeQuery } from '@cubejs-client/react';

const Chart = ({ query, cubejsApi }) => {
  const {
    resultSet,
    error,
    isLoading
  } = useCubeQuery(query, { subscribe: true, cubejsApi });

  if (isLoading) {
    return <div>Loading...</div>;
  }

  if (error) {
    return <pre>{error.toString()}</pre>;
  }

  if (!resultSet) {
    return null;
  }

  return <LineChart resultSet={resultSet}/>;
};
In this tutorial, I'll show you how to build a real-time dashboard with
MongoDB. The same approach could be used for any databases that Cube.js supports.
For quite a long time, doing analytics with MongoDB required additional overhead compared to modern SQL RDBMS and Data Warehouses associated with aggregation pipeline and MapReduce practices. To fill this gap, MongoDB released the MongoDB connector for BI, which acts as a MySQL server on top of your MongoDB data. Under the hood, it bridges existing aggregation mechanisms to the MySQL protocol, allowing standard MySQL clients to connect and issue SQL queries.
Setting up MongoDB and BI Connector
If you don’t have a MongoDB instance, you can download it here. The BI Connector can be downloaded here. Please make sure you use the MongoDB version that supports the MongoDB connector for BI.
After the BI connector has been installed, please start a mongod instance first. If you use the downloaded installation, it can be started from its home directory like so:
$ bin/mongod
The BI connector itself can be started the same way:
$ bin/mongosqld
Please note that mongosqld resides in another bin directory. If everything works correctly, you should see a success log message in your shell for the mongosqld process:
[initandlisten] waiting for connections at 127.0.0.1:3307
If you’re using the MongoDB Atlas, you can use this guide to enable BI connector.
Getting a Sample Dataset
You can skip this step if you already have data for your dashboard.
We host a sample events collection, which you can use for a demo dashboard. Use the following commands to download and import it.
$ curl https://cube.dev/downloads/events-dump.zip > events-dump.zip
$ unzip events-dump.zip
$ bin/mongorestore dump/stats/events.bson
Please make sure to restart the MongoDB BI connector instance in order to generate an up-to-date MySQL schema from the just added collection.
Creating Cube.js Application
We are going to use Cube.js CLI to create our backend application; let's first install it.
$ npm install -g cubejs-cli
Next, create a new Cube.js application with the MongoBI driver.
$ cubejs create real-time-dashboard -d mongobi
Go to the just created real-time-dashboard folder and update the .env file with your MongoDB credentials.
CUBEJS_DB_HOST=localhost
CUBEJS_DB_NAME=stats
CUBEJS_DB_PORT=3307
CUBEJS_DB_TYPE=mongobi
CUBEJS_API_SECRET=SECRET
Now let's start a Cube.js development server.
$ npm run dev
This starts a development server with a playground. We'll use it to generate Cube.js schema, test our data and, finally, build a dashboard. Open http://localhost:4000 in your browser.
Cube.js uses the data schema to generate an SQL code, which will be executed in your database. Data schema is a JavaScript code, which defines measures and dimensions and how they map to SQL queries.
Cube.js can generate a simple data schema based on the database’s tables. Select the events table and click “Generate Schema.”

Once the schema is generated, we can navigate to the “Build” tab and select some measures and dimensions to test out the schema. The "Build" tab is a place where you can build sample charts with different visualization libraries and inspect how that chart was created, starting from the generated SQL all the way up to the JavaScript code to render the chart. You can also inspect the JSON query, which is sent to the Cube.js backend.

Although auto-generated schema is a good way to get started, in many cases you'd need to add more complex logic into your Cube.js schema. You can learn more about data schema and its features here. In our case, we
want to create several advanced measures and dimensions for our real-time dashboard.
Replace the content of schema/Events.js with the following.
cube(`Events`, {
  sql: `SELECT * FROM stats.events`,

  refreshKey: {
    sql: `SELECT UNIX_TIMESTAMP()`
  },

  measures: {
    count: {
      type: `count`
    },

    online: {
      type: `countDistinct`,
      sql : `${anonymousId}`,
      filters: [
        { sql: `${timestamp} > date_sub(now(), interval 3 minute)` }
      ]
    },

    pageView: {
      type: `count`,
      filters: [
        { sql: `${eventType} = 'pageView'` }
      ]
    },

    buttonClick: {
      type: `count`,
      filters: [
        { sql: `${eventType} = 'buttonCLicked'` }
      ]
    }
  },

  dimensions: {
    secondsAgo: {
      sql: `TIMESTAMPDIFF(SECOND, timestamp, NOW())`,
      type: `number`
    },

    anonymousId: {
      sql: `anonymousId`,
      type: `string`
    },

    eventType: {
      sql: `eventType`,
      type: `string`
    },

    timestamp: {
      sql: `timestamp`,
      type: `time`
    }
  }
});
First, we define measures for our dashboard. The count measure is just a simple count of all total events; pageView and buttonClick are counts of corresponding events. The online measure is a bit more complex. It returns the number of unique users who performed any event in the last 3 minutes.
Within dimensions we have simple anonymousId, eventType, and timestamp, which just shows the values from corresponding columns. We've also defined a secondsAgo dimension, which calculates the number of seconds since the event's occurrence.
Lastly, we are setting a custom refreshKey. It controls
the refresh of the Cube.js in-memory cache layer. Setting it to SELECT will refresh the cache every second. You need to carefully select the best refresh strategy depending on your data to get the freshest data when you need it, but, at the same time, not overwhelm the database with a lot of unnecessary queries.
UNIX_TIMESTAMP()
So far we've successfully configured a database and created a Cube.js schema our dashboard. Now it is time to build a dashboard itself!
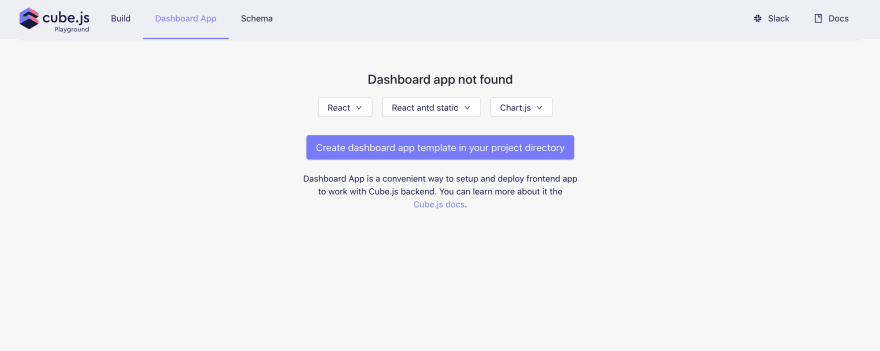
Cube.js Playground can generate a boilerplate frontend app. It is
a convenient way to start developing a dashboard or analytics application. You can select your favorite frontend framework and charting library and Playground will generate a new application and wire all things together to work with the Cube.js backend API.
We'll use React and Chart.js in our tutorial. To generate a new application, navigate to "Dashboard App,” select "React Antd Static" with "Chart.js," and click on the “Create dashboard app” button.
It could take a while to generate an app and install all the dependencies. Once it is done, you will have a dashboard-app folder inside your Cube.js project folder. To start a dashboard app, either go to the “Dashboard App” tab in the playground and hit the “Start” button, or run the following command inside the dashboard-app folder:
$ npm start
Make sure the Cube.js backend process is up and running since our dashboard uses its API. The frontend application is running on http://localhost:3000.
To add a chart on the dashboard, you can either edit the dashboard-app/src/pages/DashboardPage.js file or use Cube.js Playground. To add a chart via Playground, navigate to the "Build" tab, build a chart you want, and click the "Add to Dashboard" button.
Configure Cube.js for Real-Time Data Fetch
We need to do a few things for real-time support in Cube.js. First, let's
enable WebSockets transport on the backend by setting the CUBEJS_WEB_SOCKETS environment variable.
Add the following line to the .env file.
CUBEJS_WEB_SOCKETS=true
Next, we need to update the index.js file to pass a few additional options to the Cube.js server.
Update the content of the index.js file the following.
const CubejsServer = require('@cubejs-backend/server');

const server = new CubejsServer({
  processSubscriptionsInterval: 1,
  orchestratorOptions: {
    queryCacheOptions: {
      refreshKeyRenewalThreshold: 1,
    }
  }
});

server.listen().then(({ port }) => {
  console.log(`🚀 Cube.js server is listening on ${port}`);
}).catch(e => {
  console.error('Fatal error during server start: ');
  console.error(e.stack || e);
});
We have passed two configuration options to the Cube.js backend. The first, processSubscriptionsInterval, controls the polling interval. The default value is 5 seconds; we are setting it to 1 second to make it slightly more real-time.
The second, refreshKeyRenewalThreshold, controls how often the refreshKey is executed. The default value of this option is 120, which is 2 minutes. In the previous part, we've changed refreshKey to reset a cache every second, so it doesn't make sense for us to wait an additional 120 seconds to invalidate the refreshKey result itself, that’s why we are changing it to 1 second as well.
That is all the updates we need to make on the backend part. Now, let's update the code of our dashboard app. First, let's install the @cubejs-client/ws-transport package. It provides a WebSocket transport to work with the Cube.js real-time API.
Run the following command in your terminal.
$ cd dashboard-app
$ npm install -s @cubejs-client/ws-transport
Next, update the src/App.js file to use real-time transport to work with the Cube.js API.
-const API_URL = "http://localhost:4000";
+import WebSocketTransport from '@cubejs-client/ws-transport';
 const CUBEJS_TOKEN = "SECRET";
-const cubejsApi = cubejs(CUBEJS_TOKEN, {
-  apiUrl: `${API_URL}/cubejs-api/v1`
+const cubejsApi = cubejs({
+  transport: new WebSocketTransport({
+    authorization: CUBEJS_TOKEN,
+    apiUrl: 'ws://localhost:4000/'
+  })
 });
Now, we need to update how we request a query itself in the src/components/ChartRenderer.js. Make the following changes.
-const ChartRenderer = ({ vizState }) => {
+const ChartRenderer = ({ vizState, cubejsApi }) => {
   const { query, chartType } = vizState;
   const component = TypeToMemoChartComponent[chartType];
-  const renderProps = useCubeQuery(query);
+  const renderProps = useCubeQuery(query, { subscribe: true, cubejsApi });;
   return component && renderChart(component)(renderProps);
 };
That's it! Now you can add more charts to your dashboard, perform changes in the database, and see how charts are updating in real time.
The GIF below shows the dashboard with the total count of events, number of users online, and the table with the last events. You can see the charts update in real time as I insert new data in the database.
You can also check this online live demo with various charts displaying real-time data.
Congratulations on completing this guide! 🎉
I’d love to hear from you about your experience following this guide, please feel free to leave a comment below!
To learn how to deploy this dashboard you can check the full version of the Real-Time Dashboard guide here.


Top comments (3)
Can we use a CSV file from Apache JMeter and push this to the dashboard?
Hey NaveenKumar! You can stream this data to your database and then have Cube.js on top of it for real-time dashboard.
Thanks Artyom.