Ah, so you’ve reached that point: you’ve been through the euphoria and the buzz of setting up a Lambda function, and the eureka moment when everything is running… but then everything comes crashing down when you realise how painful debugging AWS Lambda is! I know, because I’ve been there too.
How to debug AWS Lambda? Debugging AWS Lambda is achieved through a range of different methods: using local debugging tools e.g. docker-lambda and serverless offline, through monitoring tools e.g. CloudWatch and through the implementation of a test harness.
The topic of debugging an AWS Lambda function can get complicated quickly, as there’s lots of different options and approaches. Today I’ll walk you through all the different options that you have at your disposal for debugging AWS Lambda. Today we’ll cover everything from Docker Lambda to CloudWatch.
How To Approach AWS Lambda Debugging
The main strength of AWS Lambda, the tight integration with other AWS services can also be the biggest pain when it comes to debugging. These tight integrations with AWS can be hard to replicate locally and can cause immense frustration when you’re trying to replicate an issue to fix it.

Because of the challenges with local replication and tight integration I suggest you approach your AWS Lambda debug effort from three separate angles. I’ll cover all of these angles in plenty of detail (so don’t worry) but before we do jump into that detail let’s at least get an overview of all three approaches.
Setup Local Debugging — The first part of the approach is investigating different options for local replication. There’s a range of different tools you can try which all make local AWS Lambda replication (kinda) possible. But, I don’t suggest you invest much time in this approach; I’ll explain why very soon.
Setup Monitoring — The second part of the approach is a good monitoring setup. A good monitoring setup will drastically reduce your reliance on local setup and debugging. Since replicating the AWS environments / services exactly is really hard, ensuring you’ve got appropriate visibility into your real running AWS Lambda function can be a huge asset to help you debug.
Setup A Test Framework — The last part of the approach I recommend is to setup a well thought out testing framework. For some, setting up testing might seem an odd suggestion for debugging; you might think of testing and debugging as two separate activities. But I think debugging and testing are more related than you might believe; I’ll explain more soon.
There you have it, these are the three approaches we’ll cover for tackling debugging our AWS Lambda function. But I appreciate many of you will want the detail, so let’s get straight into the first area, local debugging.
Part 1: Setup Local Debugging
As I already mentioned earlier, due to the many integrations with AWS, local debugging with AWS Lambda can be a difficult task. I think now would be a good time to go back to my point from before that I don’t think you should spend much time on your local debug setup.
In short: I’m not a fan of trying to replicate Lambda locally (at all).
Why? I have two main reasons. Firstly, because I think the more you resist cloud integrations—and search for local replication—the less return you’ll get from a cloud native approach. And secondly because I think there are better options like: focusing on monitoring and logging, and leveraging unit tests.
But we’ll come back to the topic of local replication later, I know that for many of you giving up your local running environment is simply not an option. And it’s your lucky day because there are tools to setup local replication.
Let’s start with the first local debug option, step-through debugging.
IDE Step-Through Debugging
(Source)
You might be familiar with the idea of step-through debugging already, but if not, it’s the process of placing breakpoints in your running code so that you can inspect the code and the values as the code runs. If you’re using AWS SAM, you can configure step-through debugging in your IDE.
Unfortunately for this particular option you’ll need to be using AWS SAM. But on the bright side, AWS SAM step-through debugging does work for a handful of different IDE’s: JetBrains, PyCharm, IntelliJ and Visual Studio Code.
Check out the AWS docs for details.
If you’re not using AWS SAM, and you’re just uploading a zip to run your AWS Lambda, don’t forget that you can also setup the out-of-the-box debug configurations for your language and/or IDE. You’ll need to be able to invoke your AWS Lambda function locally, but we’ll discuss how to do that soon.
Docker Lambda

The goal of Docker Lambda is to have a local running environment which emulates the AWS environment as closely as possible. It does this by running your AWS Lambda in a docker container. Docker Lambda currently supports most of the AWS Lambda runtimes.
The main advantage of Docker Lambda comes from replicating the AWS environment closely. Personally, I think the other options are better, but if precise replication is really important to you, this could be a good option.
Serverless Offline

Serverless Offline is a Serverless Framework plugin which mimics API gateway invoked requests locally. Serverless Offline doesn’t focus as much on replicating the exact environment, as it’ll be running on your machine as the host, but it will still emulate the requests event structure from API Gateway.
Lambda Local
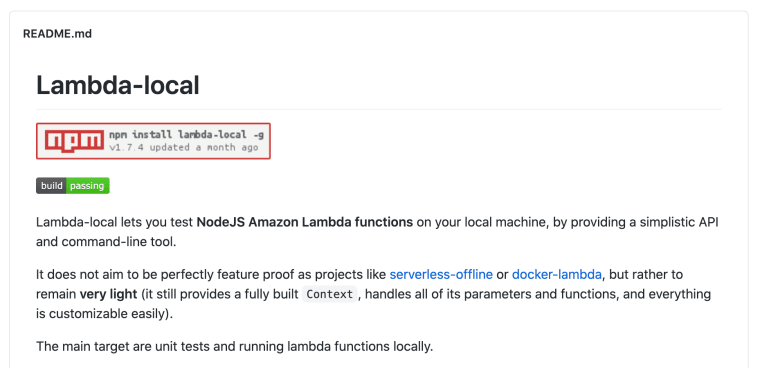
Lambda Local is a Node.JS specific lambda testing library. Lambda local doesn’t focus on providing a local running setup, but instead it provides an API which mimics the lambda invocation event which can be useful if you want to roll your own local environment.
I mentioned before when we talked about the step-through debugging that if you’re not using AWS SAM and you’re just uploading a zip you’ll need to also invoke your Lambda. That’s where libraries like lambda-local can help, as you can easily create a script to invoke your lambda and combine that with a step-through debug setup for your IDE / language.
AWS SAM Local

AWS SAM is the AWS proprietary framework which makes building and working with Serverless applications simpler. AWS SAM comes with a bunch of tools that make local testing and debug easier, such as local hosting of your lambda, and local execution.
Choosing A Local Replication Setup For AWS Lambda
As you can see, there’s many different options for you to run your AWS Lambda function locally and debug. To make things easier, let me break down what I’d suggest dependent on your situation:
- Want to emulate AWS environments? Try docker-lambda.
- Using AWS SAM and want step-through debug? Setup your IDE.
- Using Serverless Framework? Try Serverless Offline.
- Want to really buy-in to the AWS ecosystem? Setup AWS SAM.
- Using Node, and no framework currently? Try lambda-local.
Hopefully that should give you some idea of where to start when setting up local replication for your AWS Lambda.
If you remember from earlier I did mention that I don’t recommend local replication setups. Which might have had you wondering: “If you’re not recommending to use local setups, what are you recommending?”.
Let’s take a look at our next two approaches for debugging AWS Lambda, using monitoring and test frameworks. Let’s start with monitoring.
Part 2: Setup Monitoring For AWS Lambda

In my opinion one of the best ways to debug an AWS Lambda function is with the help of an effective monitoring setup. With great monitoring any desires you might have had for a local replication environment can soon disappear as you realise that local replication isn’t as necessary as you maybe first thought.
There’s also another perk to investing in monitoring instead of local debugging methods, and that is: if you are already using your monitoring / logging as part of your development process, when an incident occurs you’ll be familiar with the tools which should make you quicker to respond.
When it comes to monitoring we have a few different instrumentation types: logs, traces and metrics. Also, different readers of this article will probably be using different monitoring tools. So I’ll try to keep our discussion separate from the tools so you can apply the ideas no matter the tools you’re using.
But I know just saying to “setup monitoring” is easier said than done let me show you in-depth some monitoring patterns which I recommend. Let’s start our discussion with the first of the instrumentation types, logging.
Why Logging For AWS Lambda?

Logging is the practice of emitting small items of data from your software component for later analysis. There are many in’s and out’s of logging methodologies, and we could talk all day about it; well, I certainly could.
To get started logging, you’ll need a logging function, the naming of these vary per language, and you’ll need somewhere to send your logs. If you don’t have any log tooling, you can use CloudWatch, the AWS default service.
To setup CloudWatch your AWS Lambda will need an associated log group and IAM permissions granted to the AWS Lambda to write to the log group. I’ve explained this process in detail before, so if you want help setting CloudWatch up, check out: How To Get AWS Lambda Logs Into CloudWatch.
What Should You Log From AWS Lambda?
One of the first, and important questions you’ll probably have is: “what, and when should I be logging?” Let me take you through some of the main things that I’d recommend you ensure you’re covering with logs.
- AWS Lambda Input Event — You’ll want to log the inputs of your function, most obvious is the event which triggered the lambda, but you’ll also want to log things like your (non-sensitive) environment variables which can affect your function behaviour.
- Lambda Response / Output — You’ll also want to log the output of your function, what did your function return? If you’re returning any error codes, you’ll want to log these too.
- Errors — Every time you perform some action that might throw an error (and yes, I realise that’s pretty much everything!) you’ll want to capture and log any relevant details for the error. For instance if you are making a request, you might want to know the URL and the payload being sent.
Now I know sometimes these abstract discussions can be hard to picture in your head, right? Let me show you how this could look in code. A simple example (in Node.JS) of all three of these logs would look something like this:
This example is painfully simple just to explain the idea, frankly there’s many areas you could improve, for instance: using a log library, introducing logging levels, adding a log format and structuring the log into JSON.
The topic of what/ when to log also closely relates to the topic of error handling. We don’t have time to cover error handling today, but I have written up a philosophy for error handling previously that would be worth a read: A Philosophy For Effective Error Handling (Using JavaScript Examples)
It’s also difficult to give many strict rules around what/when to log, and logging at times can feel more like an art than a science. But, over time you’ll naturally start to understand your AWS Lambda behaviour and it’s error states more and more and you’ll continue to improve your log coverage.
Trying to put observability post-factum into software is much harder than just doing it from day 1. It takes time to get all the right dimensions and properties emitting correctly, and the best time to exploit this feedback loop is from day 1 of the components lifetime.09:30 AM - 22 Oct 2020


Also, what I’ve found is one of the best times to improve your logging (and monitoring in general) is following an incident. During an incident you’ll realise the data which you’re missing from your logs and you’ll spot ways to improve them. Don’t forget to write these improvements down so you can come back and implement them in future.
There's no better way to improve the observability of a system than a real incident (unfortunately).10:30 AM - 29 Oct 2020
Okay, and there’s one thing I absolutely must share with you before we move on. I have spent a lot of time in searching for the optimal monitoring / logging setup, and I’ve had some great success with a slightly unconventional logging format that I wanted to share with you called log events.
For whatever reason the industry hasn’t yet realised that log events are the future of monitoring and logging. I didn’t want to cover it too much today, as I don’t want to confuse things too much, but I really think you should check it out. I did a write up of the pattern here: You’re Logging Wrong: What One-Per-Service (“Phat Event”) Logs Are and Why You Need Them.
So far we’ve only talked about shipping logs, but we haven’t actually discussed how you can use them to your advantage. Let’s now take a look at how querying and visualising the logs can help your debug efforts.
Querying And Analysing Logs
Your logs aren’t useful for anything more than creating an AWS bill if you’re not able to extract information from them. You may have a log analysis tool already setup, but if not I can recommend using AWS CloudWatch insights.
With CloudWatch insights you can analyse the log data emitted from your AWS Lambda function. CloudWatch insights has a powerful query syntax that lets you count, group and parse your logs. You can even take these logs and visualise them on a CloudWatch dashboard as charts and tables.
Visualising logs can be particularly useful for debugging. To give an example, recently as I investigated an issue, I created a dashboard and stacked some charts on top of each other to look for correlations between events.
When you find useful queries you can either add them to your dashboards, or store them back with your project in a flat file. Personally, I store all my queries in a file called runbook.md which lives alongside the AWS Lambda code.
We’ve discussed now a lot about logging, but I also mentioned metrics and traces earlier. Let’s take a look at both of these now.
Traces And Metrics For Debugging AWS Lambda

The reason we’ve talked a lot about logs and left metrics and traces out is for a simple reason: metrics and traces aren’t as important for debugging as logging is. But, I do want to cover them briefly here as they can be useful in some use cases, and I want you to know how they work if you need them.
Firstly, let’s discuss metrics. Metrics are aggregate values used to assess the health of your component. Unlike logs, which are highly detailed, metrics are usually higher-level metrics, such as average response times, or error rate.
Metrics are predominantly useful for creating alerts, and for getting a high-level picture of your AWS Lambda health. With AWS Lambda you get a set of basic, mostly generic metrics out-of-the-box (source) such as: invocations and errors.
You can use metrics to aid debugging by adding them to your dashboards that we talked about earlier. It’s also possible to add custom metrics, and there are many libraries and tools (e.g. node, python, etc) which can help you do this.
But what about traces? Tracing is instrumentation which usually spans many different components, traces help you understand how different components interact, and AWS also has an out-of-the-box tracing solution, X-Ray.

The reason I won’t mention tracing, and X-Ray much today is because tracing is mostly useful in larger, multi-service applications. If that does apply to you, X-Ray could be a useful additional tool to help you debug. But I still think for most that focussing on logging first is the best option.
And on the note of metrics and traces, that’s the end of our section on monitoring. We’ve covered a lot here, but the main takeaway is that you’ve got many tools to help you debug, spending the time instrumenting your AWS Lambda function can be incredibly useful towards your debug effort.
Last up: Using testing frameworks to aid debugging in AWS Lambda.
Part 3: Setup A Test Framework
When it comes to debugging AWS Lambda, a well structured test framework can go a long way to aiding the replication of bugs, and identification of edge cases which might have caused the bugs you’re searching for.
There is a concept in the testing world that goes like this: bugs are tests that weren’t written. What this means in simple terms is with a good test harness any bug should be reproducible with a failing test.
But, the ability to catch bugs using a test framework relies on us having an appropriately setup test framework, and of course I have some opinions on how to set up a test framework specifically for AWS Lambda.
Approaching Tests AWS Lambda
When it comes to testing AWS Lambda I like to break down the effort into three distinct parts: unit tests, component tests, and integration tests. You may already be familiar with the concepts, but it’s worth going over them in the context of AWS Lambda as the layers can be slightly different.
Unit tests — Unit tests you might be most familiar with. With unit tests you test the smallest part of your component, typically isolated functions. With unit tests all external calls are mocked, and the unit tests are fast to run. My library of choice for Node.JS is Jest.
Component tests — Component tests are magical for testing AWS Lambda. Rather than testing individual functions, you unit test the entire handler of your AWS Lambda. Component tests can give you a large amount of confidence that your AWS Lambda function will work as expected. I also write these with Jest.
Integration tests — Lastly is the integration test. Integration testing should test the integrations between your AWS Lambda and other systems or components. If you’re making a HTTP API, then testing using HTTP requests would be a good integration test. My library of choice for Node.JS is Supertest.
I know that talking about these test layers can get quite abstract and theoretical. But since AWS Lambda is written in many different languages, and since I also don’t know the language you’re using I chose to keep things generic.
The key point I want to stress here is for effective testing and debugging of AWS Lambda, I recommend leveraging all of these testing layers. But, I also think you should pay particular attention to component tests. If written well component tests can execute very fast and with guaranteed repeatability.
As we discussed earlier on, if you have a test framework setup that covers all three of these layers you should be able to debug your AWS Lambda using tests only. If you’ve never used the technique of debugging using tests, it can feel quite foreign, but give it a go, and soon I think you’ll struggle to go back.
Go Debug Your Lambda!
And that concludes our walk through of debugging an AWS Lambda function.
In part one we discussed how to debug your application with local replication and step-through debugging. In part two we discussed setting up monitoring for your AWS Lambda function. And in part three we discussed how to setup a test framework for AWS Lambda.
If you cover all three of these areas, debugging your AWS Lambda function should become considerably easier, giving you many debugging options to choose from. But the best use of your time—as I mentioned at the start—in my opinion is to focus on a good test framework and monitoring setup.
I hope that helped point you in the right direction for debugging AWS Lambda. If you’re interested to learn more about cloud engineering, you might want to check out: My (Highly!) Recommended Books & Courses To Learn Cloud Engineering, or if you’re interested to deep dive into Serverless, then consider checking out: Serverless: An Ultimate Guide.
The post How To Debug AWS Lambda: A Detailed Overview appeared first on The Dev Coach.
If you’re interested in Cloud I write a monthly newsletter for Cloud Software Engineers. I spend the month digging around the internet for the best cloud engineering content and provide a monthly summary. I read every article I share, and I focus on fundamentals as much as possible.


Top comments (3)
Good stuff! Also worth checking out arc.codes/docs/en/guides/developer... which makes SAM a bit nicer. (=
Ah! I'm yet to use that framework, I'll give it a go!
Thanks for the heads up 🙏
very well written and detailed article!