Chrome is increasingly not just a browser of choice, but also a powerful development tool in its own right. New features are regularly introduced, some of which fall more naturally into (my) development cycles than others.
Here are some of the features I make the best use of and think are worth a wee highlight:
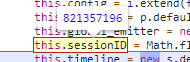
1. Conditional Breakpoints
Adding breakpoints to the script sources is an incredibly helpful way to know what's going wrong (or right!) and where. Being able to add conditional breakpoints helps you to get to the root of a problem even quicker by specifying parameter criteria that you are interested in investigating further. Ideal!

Read more about conditional breakpoints here.
2. Watch variables
It is possible to interrogate variables in the sources window when a breakpoint is engaged. This looks a bit like this:
This is fine, but say you want to keep an eye on multiple variables at the same time or want to compare, or just remind yourself what they are (or should be), then it's possible to expand the watch panel on the right-hand side and add as many variables there as you'd like:

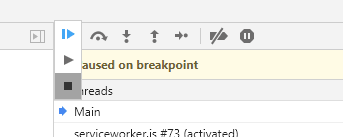
3. Stop Infinite Loops
If you have ever accidentally run a javascript function, realised a second too late and had to watch as your computer begins to grind to a halt as you feverishly try to force quit Chrome, then this one is for you...
Hit pause script, and then...
Read more about stopping infinite loops here.
4. Measure interactions
Ever wanted to know how long something takes on a website...?
- How long after page load does someone play a video or click a button?
- Where are the performance bottlenecks? How long does a script method take to run?
You can now use window.performance to trigger measurement starts and completions, and consequently extract the data.
onPageLoadOrMethodStart() {
    window.performance.mark('start');
    ...
}

onMethodCompletionOrCtaInteraction() {
    window.performance.mark('end');
    window.performance.measure('customMeasure', 'start', 'end');
}

retrieveData() {
    const customPerf = window.performance.getEntriesByName('customMeasure')[0].duration;
}
Handily, the data is also printed out in the performance window on the top panel, so you can see all measurements at a glance. Awesome!
Read more about measuring real world interactions using the User Timing API.
5. Pretty print minified files
Minified files in production are industry standard, and are to be expected, but sometimes it's handy to attach breakpoint or look into individual structures or methods. Make it readable - make it pretty! (bottom left-hand corner of the sources panel):

6. Monitor Events
Ever wondered why your event listeners weren't firing, or were firing at random times?
You can track page events and interactions using the console.
Try it now:
- Right click and "inspect" the search input bar at the top of the page
- Copy this into the console:
monitorEvents($0, "key"); - Type something into the search input...
Read more about monitoring events here.
7. Export Requests Data
You've got a problem. Something looks weird, but you're not sure why. You've got heaps of network requests to sift through, the answer must be in there somewhere... You could really use a hand, wouldn't it be handy to share them with someone else?
You can!
You can download the requests as a HAR file, and send it to a colleague who can import it into their Chrome to cast an eye over the requests also. Simply right-click on any request and select Save as HAR with Content. Ta-da.
Read more about exporting requests data and how to analyze HAR files.
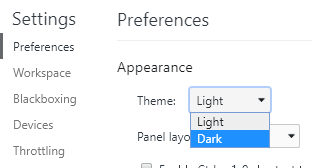
8. Enable dark theme (purely aesthetic...)
Open dev tools > go to Settings
Toggle it!
9. Chrome Extensions
There are also a load of really handy extensions for use with various frameworks and tools. Ones that I have found particularly useful are:
- VueJS dev tools (Really excellent user experience)
- ReactJS dev tools
- Google Analytics


Top comments (8)
Didn't know about 2,3, & 4. Thanks! Augury for angular and redux devtools are also great!
Ahh awesome, I'll have to try Augury out next time I am tinkering in Angular - thanks! :)
I didn't know all but 3 of those but these are extremely useful and handy! Just hope I remember them when I need them 😆
Thank you!
Haha, yes that’s always the cinch of it isn’t it - remembering them! Hope they come in useful for you :)
I never use performance feature, nice tips, very useful. Thanks
Thank you! Glad it might be of some use :)
Thanks for the number 8 ;)
Haha! No worries 😛 thought I would just throw it on in there 😇