In 2018 I had the chance to attend a workshop hosted by some great devs from NearForm along a JS conference.
They showed how to find bottlenecks on Node.js applications using Flamegraphs using a very nice profiler they built called Clinic JS.
Too bad, I lost the notes about that workshop, but I remembered the tool name. So I've downloaded it and used it successfully to find an actual bottleneck while working on a side project of mine.
Here's briefly how it works through a super simple example.
Example app: a slow REST API service (or similar)
Let's fire up a very basic HTTP service using the plain node http module, which basically is:
- simulating a slow query returning a random number (
dbQuery) - computing with the result it computes the Fibonacci series (
fib) - returning the Fibonacci value in plain text
const http = require('http')
const { fib, dbQuery } = require('./util')

const hostname = '127.0.0.1'
const port = 3000
const baseUrl = `http://${hostname}:${port}`

const server = http.createServer((req, res) => {
  res.statusCode = 200
  res.setHeader('Content-Type', 'text/plain')

  dbQuery()
    .then(fib).then(result => {
      res.end(`${result}\n`)
    })
    .catch(err => res.send(err))
})

server.listen(port, hostname, () => {
  console.log(`Server running at ${baseUrl}`)
})
The util.js module looks like:
const random = (min, max) => Math.floor(Math.random() * (max - min + 1)) + min

const sleep = s => new Promise(resolve => setTimeout(resolve, s * 1000))

const dbQuery = async () => {
  await sleep(random(1, 5)) // ugh!
  return random(10, 40)
}

function fib (n) {
  if (n <= 1) return 1
  return fib(n - 1) + fib(n - 2)
}

module.exports = { dbQuery, fib }
As you can see:
-
dbQueryfunction is (intentionally) callingsleepbefore generating a random value to simulate slow I/O. -
fibis a (potentially) CPU-heavy task which will block the main Node.js main event loop, especially with bignvalues.
Basic performance testing using curl and time
If you simply fire up the service using:
$ node index.js
and then do something like:
$ time curl 'http://localhost:3000'
to test the response time, you'll find out that it's quite slow (average is around 3-5s).
One can easily guess that both dbQuery and fib functions may be the cause of the slowness, and then confirm wisely using logging.
Anyway, let's try to see how Clinic flame could help us.
Using Clinic Flame
Clinic Flame is one of the Clinic tools which is very handy in this case.
So let's run the web service through it:
$ clinic flame -- node index.js
Now we can do the same HTTP calls we did above using curl, one or two times:
$ curl 'http://localhost:3000'
When done, simply hit ctrl+c and Clinic Flame will automatically generate a report and show it to you on a browser page.
Let's look at the report:

The first thing I did was to uncheck Depedencies, WebAssembly, Node JS and V8 checkboxes from the bottom bar since I mainly want to see only how my module code is being called.
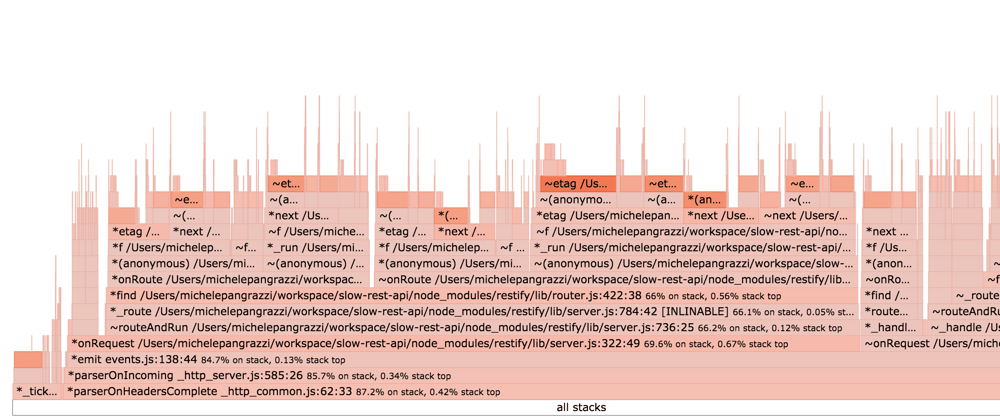
About the report, we have to look if there are wide bars with a bright colour. It basically means that the function is "hot": lot of time has being spent at the top of the stack while calling a specific function.
Here's one:

and it's related to the dbQuery().then(fib).then( // ... code block.
Note also that we have lots of calls to fib (which is ok for a recursive function) but with darker bar colours:
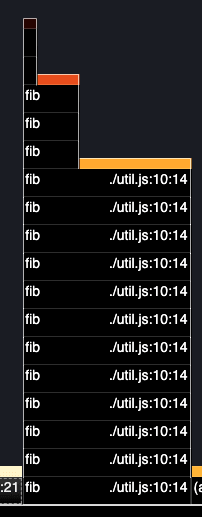
This means that dbQuery took more time at the top of the stack than fib function. Probably we sleep more than the time needed to compute fib with the random value.
What if it happens the opposite (i.e. less or no sleep time for dbQuery and a larger n for fib)?
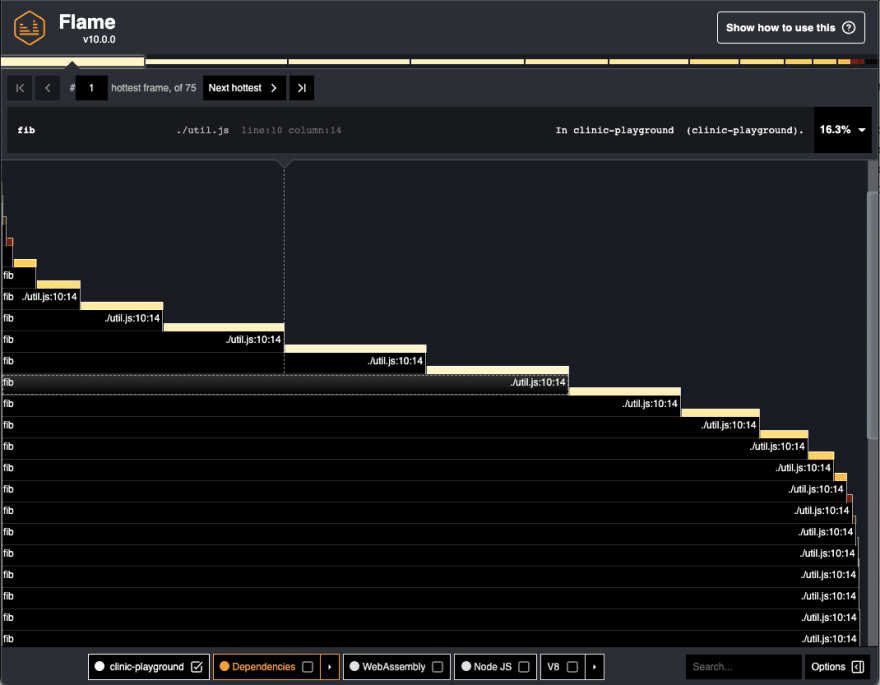
This time basically all the bars are related to the fib function and they're super wide: it means that all the recursive calls to fib took a lot of time.
Note also that if you check Node JS or V8 bars, they're super thin in comparison with fib ones. This means than internal Node.js routines took a very short time compared to fib calls.
Why it could be useful?
If you have trouble to understanding bottlenecks in your Node.js-based web service, especially if the "blocking" issue comes from one of your node_modules deps, where putting random console.log calls to debug is both not easy and time consuming.
Moreover, if your blocking issue is appearing only on heavy load, you can easily test it using the very nice --autocannon CLI param (see it with clinic flame --help) where you can specificy autocannon options to generate some HTTP load on your web service.


Top comments (1)
I read your article well.
But I have worrisome problems.
Can you help me?