Reading flamegraphs is hard. It takes practice. But here's one shortcut.
Probably a day doesn't go by when I don't look at some kind of flamegraph or waterfall visualization, usually in Speedscope or Chrome DevTools.
I teach how to read flamegraphs in a lot of my books and in my workshop, but it's something that I always see people struggle with. To some extent, reading and understanding these things is just a skill, and skills need constant practice.
However, if I had to break down flamegraph-reading into sub-skills, there's one thing that I would say is most important: being able to determine which frames are important and meaningful.
As a process runs, it is stopped every X milliseconds. When it is stopped, the process' current stack is recorded. For example, Frame A called Frame B which called Frame C, and so on and so forth. In case you need a reminder, the execution stack is the thing that gets printed when you look at an exception backtrace, for example. With an exception, we just capture the stack once, but with a performance profiler, we're capturing at a constant interval of milliseconds.
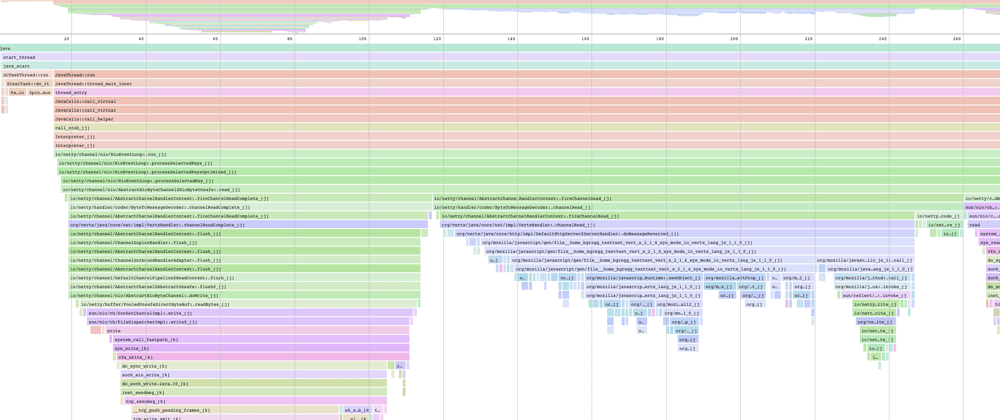
Flamegraphs simply visualize this process by placing each of these recorded stacks side by side. The resulting visualization looks like "flames", hence a "flame graph". If you do this visualization where the "parent" of all the stack frames is on the top, rather than the bottom, you get a "waterfall graph", because it looks like a waterfall. It's the same thing though. Speedscope and DevTools visualize using the waterfall format, but I still call them flamegraphs anyway.
I think the number one thing you need to learn how to do read a flame graph effectively is to understand which frames to ignore. In any stack, there will be frames that are what I call "pass-through" frames, or frames which basically don't do anything. You can easily identify a passthrough frame because it:
- ... has very little time actually spent in the frame. The frame is never on the top of the stack, it only calls out to child frames. This is usually a good indicator that this frame doesn't do very much important stuff.
- ... is usually at the "base" of the flamegraph, close to the root frame. The "higher up" you get in the stack, the closer you are to your application code, which is where the meaningful stuff is.
- ... is in a dependency. Look at the frame's source code location. Are we looking at the internals of a library, or is it in your application itself? Almost all frames in your application directory are important, but often your dependencies will show up and add a lot of frames that just aren't interesting.
On the flip side, it's also good to know which frames are interesting:
- Frames whose source code location is in your application root directory. Usually the flamegraph tool will visualize different source code directories as different colors.
- Quickly look for what color means "in your app directory" and then ignore most of the other colors to start.
- Frames that spend a lot of time "in self", i.e. not calling out to a child frame. This means there are no frames further up the stack.
This is usually where I spend most of my time looking at flamegraphs.
Capturing flamegraphs is quite easy these days, and depends on what you're trying to profile:
- rack-mini-profiler will generate flamegraphs for Rails backend requests.
- Chrome DevTools generates excellent flamegraphs in the Performance tab for browser behavior/page loads.
- stackprof can be used alone/by itself to generate flamegraphs for arbitrary Ruby code.
- TestProf can be used to get flamegraphs for Ruby test suites.
Flamegraphs are a critical performance tool. But if you don't "get it" at first, don't sweat it - you're not the only one. Just keep trying, keep looking, and eventually you learn the "pattern recognition" necessary to use them effectively.


Top comments (0)