
Table of contents:
- Introduction
- Learning python
- Pandas datatypes
- Importing data
- Exporting data
- Describing data
- Viewing and selecting data
- Boolean operators
- Final thoughts
Introduction
After we did the set up of our environment we can now do the actual work, and to be able to do it we have to learn python and its library dedicated to the data analysis, pandas.
Learning python
Learning python is very easy, and if you have any experience with a programming language will certainly learn python easily. I'll not cover it by myself just because you can find all you need here. or, if you want to overkill, learn python the hard way
What we will use here are especially lists and matrixes, but not at a difficult level. This will be just an overview of the various ways to display data in pandas, so don't be afraid, we are all newbies here.
Pandas datatypes
As we saw in the setup, we'll do everything on jupyter notebook, where you should already have imported all the packages, for this example, I'll create a new notebook with just pandas in it.
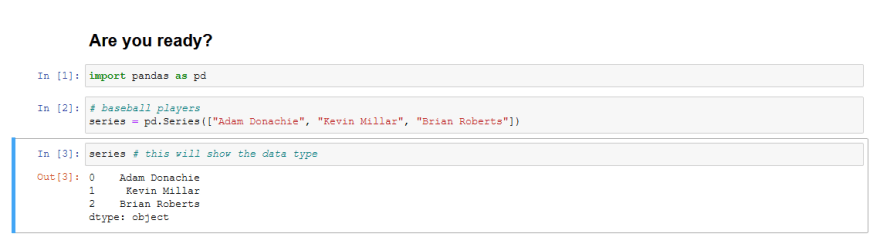
There are two main data types in pandas, the first is a Series, the pandas name for a list.
Series
Now let's create another series so we can introduce the second data type.

DataFrames
Remember when we have talked about matrixes? that is simply the technical names for tables, called in pandas DataFrame.

Importing data
But always writing data is tedious and not efficient, we'll probably already have all the data, sample or not, and what we'll have to is importing it.
The most common file used to get data is .csv, which is like an excel file.
I have already put the csv file "baseball_players" into the main folder, so I can see it here:

Now to have the data to work on I have to just type:

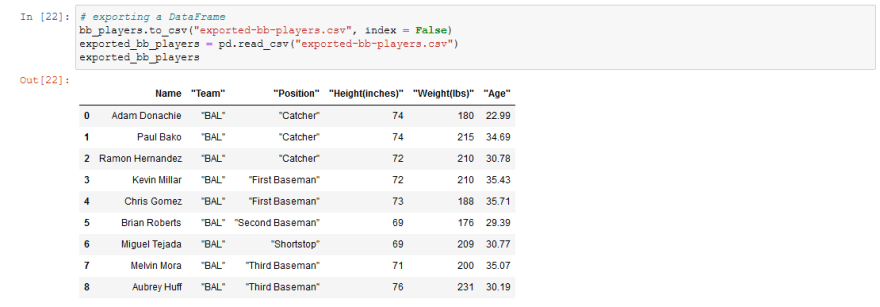
Exporting data
Once we have worked with our data we may want to export them, and to do it is very simple.

But we have a problem, we have an extra column that displays the index of rows as it would be a series of the DataFrame.
To remedy this we can modify the exporting function by adding a parameter that says
index = False
Describing data
Before describing data we have to know a little detail, the difference between a function and an attribute.
A function is a piece of code that may or may not require parameters and that can change the data, it has () at the end.
An attribute is similar to a function but is used just for visualization and has no brackets, even if the underline operations are the same as a normal function.
dtypes attribute
Using this attribute we can notice two things:

First that there is an error in the sample and that the name of the columns that are between quotation marks.
Second, now we know the types of data we are using.
Note: now I had to manually adjust all the data between quotation marks and it was simply because this data set was just 10 rows, but in a dataset, with thousands of data this kind of error may be crucial.
Columns attribute
This attribute will show to us all the columns of the data frame.

but instead of always using this attribute we can just give it to a variable that we can use when needed.

Info function
This function will give us information about the dataset that we are working on.
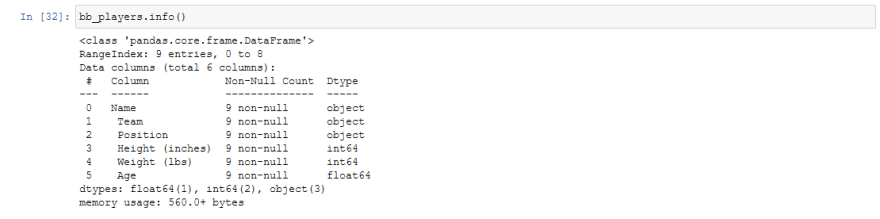 Included the memory usage.
Mean function
This function will show us more or less information about the DataFrame, but for more accurate options you can see the doc

Viewing and selecting data
Pandas offer a lot of useful functions to display data and select them, the most useful are head and tails.
Head function
Calling the head function on our DataFrame will show us the first 5 elements. It accepts even a number so that we can view the first n element of what we are working on
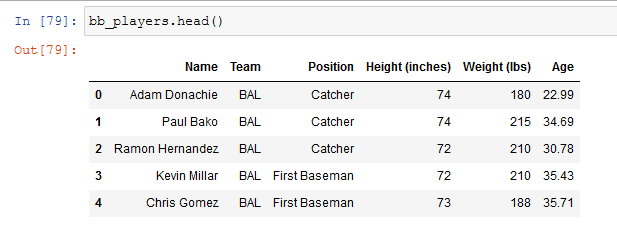
It may be useful to have a quick look at big DataFrame with thousands of rows so that just viewing the first 3, 5 or 7 we can have an idea of what we are going to work on.
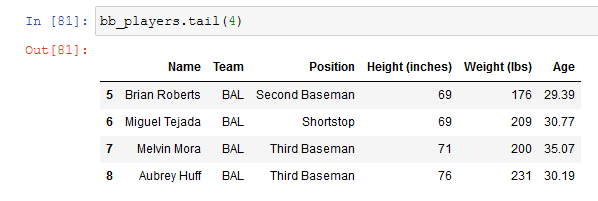
Tail function
Very similar to the head function but instead of the first it shows the last elements of a DataFrame.
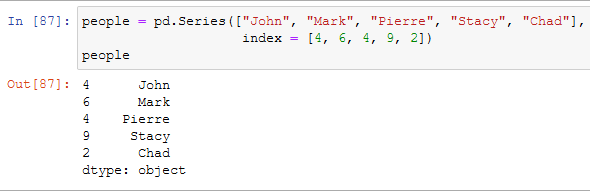
Loc function
Let's create series to illustrate this function
Now let's call the function
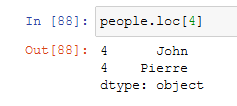
Very strange and situational, but still good to know.
Iloc function
We'll use the same array of before to illustrate what iloc does

it returns the fourth element of the series, still beginning from 0, referring to the real position of the series.
Both loc and iloc have precise properties, similar to when in python one prints a string followed by [], it accepts a maximum of three parameters that are [start: stop: stepover].
Boolean operators
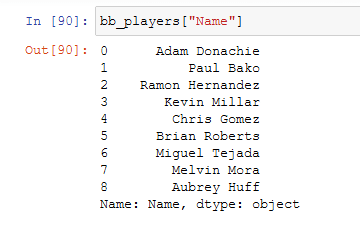
To see specific columns we can type two commands:
the brackets notation
or the dot notation
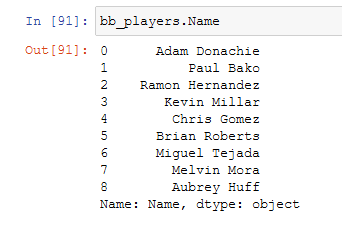
both have the same behavior, it's just preference, but they are important because we can display certain rows using them and the booleans operators.

This will work with any boolean operator and will let us search for a row, or a group of rows, with a specific feature.
Final thoughts
In the following week, I'll write the second part on python and pandas for then begin seeing numpy.
See you till the next time


Top comments (2)
I'm really enjoying your series. Kudos!
thanks man :D