
In my previous article, I talked about the importance of logs and the differences between structured and unstructured logging. Logs are easy to integrate in your application and provide the ability to represent any type of data in the form of strings.
Metrics, on the other hand, are a numerical representation of data. These are often used to count or measure a value, and are aggregated over a period of time. Metrics give us insights about the historical and current state of a system. Since they are just numbers, they can also be used to perform statistical analysis and predictions about the system behaviour in future. Metrics are also used to trigger alerts and notify about issues in system behaviour.
Logs vs Metrics
Format
Logs are represented as strings. They can be simple texts, JSON payloads, or key value pairs (like we discussed in structured logging).
Metrics are represented as numbers. They measure something (like CPU usage, number of errors, etc.) and are numeric in nature.
Resolution
Logs contain high-resolution data. This includes complete information about an event, and can be used to correlate the flow (or path) that the event took through the system. In case of errors, logs contain the entire stack trace of the exception, which allows us to view and debug issues originating from downstream systems as well. In short, logs can tell you what happened in the system at a certain time.
Metrics contain low-resolution data. This may include count of parameters (such as requests, errors, etc.) and measures of resources (such as CPU and memory utilization). In short, metrics can give you a count of something that happened in the system at a certain time.
Cost
Logs are expensive to store. The storage overhead of logs also increases over time and is directly proportional to the increase in traffic.
Metrics have a constant storage overhead. The cost of storage and retrieval of metrics does not increase too much with increase in traffic. It is however, dependent on the number of variables we emit with each metric.
Cardinality
Metrics are identified by two key pieces of information:
- A metric name
- A set of key value pairs called tags or labels
A permutation of these values provides the metric its cardinality. For e.g. if we are measuring the CPU Utilization of a system with 3 hosts, the metric has a cardinality value of 3, and can have the following 3 values:
(name=pod.cpu.utilization, host=A)
(name=pod.cpu.utilization, host=B)
(name=pod.cpu.utilization, host=C)
Similarly, if we introduced another tag in the metric which determined the AWS region of the hosts (say us-west-1 and us-west-2), we will now have a metric with a cardinality value of 6.
Types of Metrics
Golden Signals
Golden signals are an effective way of monitoring the overall state of the system and identify problems.
Availability: state of your system measured from the perspective of clients, for e.g. percentage of errors on total requests
Health: state of your system measured using periodic pings
Request Rate: the rate of incoming requests to the system.
Saturation: how free or loaded is the system. For e.g. queue depth or available memory.
Utilization: how busy is the system. For e.g. CPU load or memory usage. This is represented in percentage.
Error Rate: the rate of errors being produced in the system.
Latency: the response time of the system, usually measured in the 95th or 99th percentile.
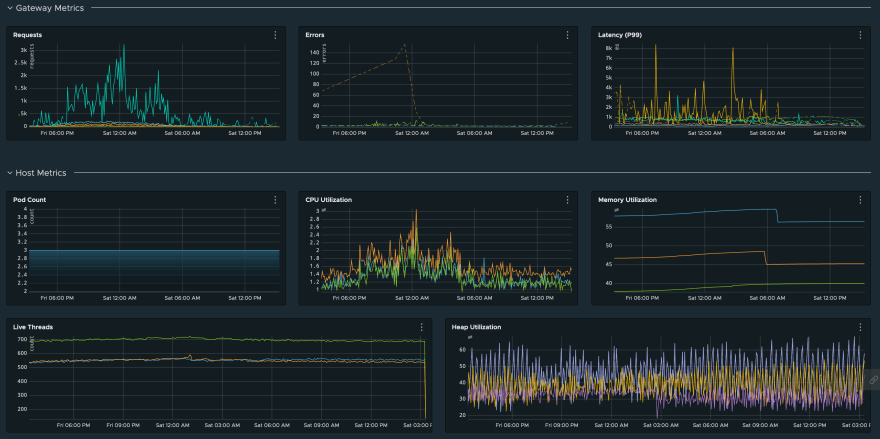
Resource Metrics
Resource metrics are almost always made available by default from the infrastructure provider (AWS CloudWatch or Kubernetes metrics) and are used to monitor infrastructure health.
CPU/Memory Utilization: usage of core resources of the system
Host Count: number of hosts/pods that are running your system (used to detect availability issues due to pod crashes)
Live Threads: threads spawned your service (used to detect issues in multi-threading)
Heap Usage: heap memory usage statistics (can help debug memory leaks)
Business Metrics
Business metrics can be used to monitor granular interaction with core APIs or functionality in your services.
Request Rate: rate of requests to the APIs
Error Rate: rate of errors being thrown by the APIs
Latency: time taken to process requests by the APIs
Dashboards and Alerts
Since metrics are stored in a time-series database, it’s more efficient and reliable to run queries against them for measuring the state of the system.
These queries can be used to build dashboards for representing the historical state of the system.
They can also be used to trigger alerts when there is an issue with the system, for e.g. an increase in number of errors observed, or a sudden spike in CPU utilization.
Due to their numeric nature, we can also create complex mathematical queries (such as X% of errors in last Y minutes) to monitor system health.
Conclusion
In this article, we saw the differences between metrics and logs, and how metrics can help us monitor the health of our system more efficiently. Metrics can also be used to create dashboards and alerts using monitoring software like Wavefront and Grafana.
The biggest challenge, however, in handling metrics is deciding the right amount of cardinality that makes the metric useful, while also keeping its costs in control. It is necessary to use both metrics and logs in coordination to accurately detect and debug issues.
Note
This is the second part of my Microservice Observability Series. The first part has been posted here. I’ll be adding links to the next articles when they go live. Stay tuned!!


Top comments (0)