
Stream Logs from Multiple Docker Services to Grafana Cloud with Alloy (Part 2)
In Part 1, we set up a basic pipeline using Grafana Alloy to stream logs from a Docker container to Grafana Cloud Loki.
Now let’s level up.
This time, we’re collecting logs from two services — liveapi-backend and runner — each writing to their own file, and we’ll push them to Loki with proper labels so filtering and visualizing in Grafana feels effortless.
The Services
We’re logging from two separate backend services inside our containerized environment:
-
liveapi-backend→/code/liveapi-backend/liveapi.log -
runner→/code/runner/runner.log
Each of these logs need to be:
- Watched by Alloy
- Parsed and labeled
- Shipped to Grafana Cloud Loki
Let’s walk through the configuration.
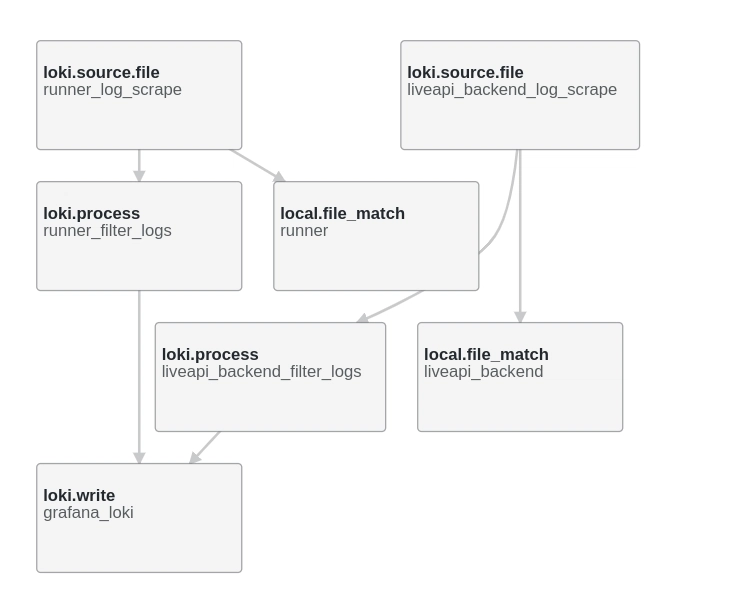
The Config File
Path: /etc/alloy/config.alloy
# Match log file paths for both services
local.file_match "liveapi_backend" {
  path_targets = [
    { "__path__" = "/code/liveapi-backend/liveapi.log" }
  ]
  sync_period = "5s"
}

local.file_match "runner" {
  path_targets = [
    { "__path__" = "/code/runner/runner.log" }
  ]
  sync_period = "5s"
}

# Source log lines from files and send to processors
loki.source.file "liveapi_backend_log_scrape" {
  targets       = local.file_match.liveapi_backend.targets
  forward_to    = [loki.process.liveapi_backend_filter_logs.receiver]
  tail_from_end = true
}

loki.source.file "runner_log_scrape" {
  targets       = local.file_match.runner.targets
  forward_to    = [loki.process.runner_filter_logs.receiver]
  tail_from_end = true
}

# Attach static labels to each log line
loki.process "liveapi_backend_filter_logs" {
  forward_to = [loki.write.grafana_loki.receiver]

  stage.static_labels {
    values = {
      job          = "liveapi-backend"
      service_name = "liveapi-backend"
    }
  }
}

loki.process "runner_filter_logs" {
  forward_to = [loki.write.grafana_loki.receiver]

  stage.static_labels {
    values = {
      job          = "liveapi-runner"
      service_name = "liveapi-runner"
    }
  }
}

# Loki write target — this is your Grafana Cloud endpoint
loki.write "grafana_loki" {
  endpoint {
    url = "https://YOUR_INSTANCE_ID:YOUR_API_KEY@logs-prod-028.grafana.net/api/prom/push"
  }
}
Replace the url with your actual Grafana Cloud Loki push endpoint.
You can find it under Logs → Details → Grafana Agent in your Grafana Cloud account.
Breakdown: What’s Happening?
Let’s decode the setup:
local.file_match
These blocks define which files Alloy watches and how often it checks for changes (sync_period).
loki.source.file
This is where log ingestion begins. Each source:
- Reads logs from the matched file path
- Starts tailing from the end (avoids re-sending old logs)
- Sends logs to the defined processor
loki.process
Adds metadata (aka labels) to each log line. These are critical for querying in Grafana. You can add whatever makes sense — service_name, env, region, etc.
loki.write
Defines the output — in our case, Grafana Cloud Loki. The URL includes:
- Your Grafana Cloud ID
- A Loki API key with write permissions
Useful Commands
Need to troubleshoot or inspect your setup?
Validate syntax and format the config
alloy fmt <config.alloy>
View the config
sudo cat /etc/alloy/config.alloy
Restart Alloy
sudo systemctl restart alloy
View logs (if running under systemd)
journalctl -u alloy -n 50 --no-pager
If journalctl isn’t available (common in Docker):
alloy run /etc/alloy/config.alloy > /var/log/alloy.log 2>&1 &
This will run Alloy in the background and dump its logs to /var/log/alloy.log.
Use tail -f /var/log/alloy.log to monitor.
Syntax Help
Want to learn more about the config language? Alloy uses a custom HCL-inspired syntax.
You can explore the syntax rules here:
🔗 https://grafana.com/docs/alloy/latest/get-started/configuration-syntax/syntax/
🧑🎨 Visual Config Generator
You don’t have to write everything by hand.
Use the Alloy Configurator to visually create a config file.
🚦 Final Thoughts
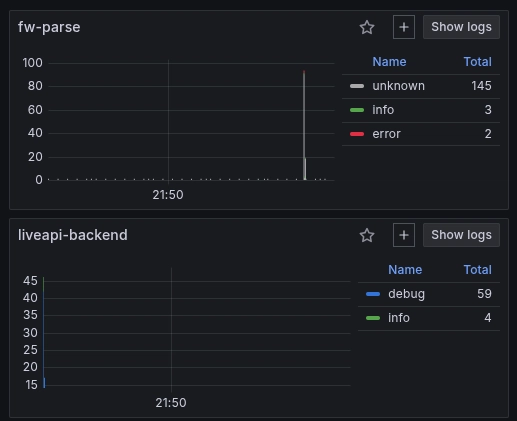
This setup gives you fine-grained control over what you ship and how you tag it.
With Alloy and Grafana Cloud Loki, you're not just centralizing logs — you’re making them searchable, filterable, and visual.
You can now:
- Split logs by service
- Add filters in Grafana using labels like
{job="liveapi-runner"} - Build dashboards based on log content
I’ve been actively working on a super-convenient tool called LiveAPI.
LiveAPI helps you get all your backend APIs documented in a few minutes
With LiveAPI, you can quickly generate interactive API documentation that allows users to execute APIs directly from the browser.
If you’re tired of manually creating docs for your APIs, this tool might just make your life easier.

Top comments (0)