Title
How to configure gradual change colors for discrete data in VChart?
Description
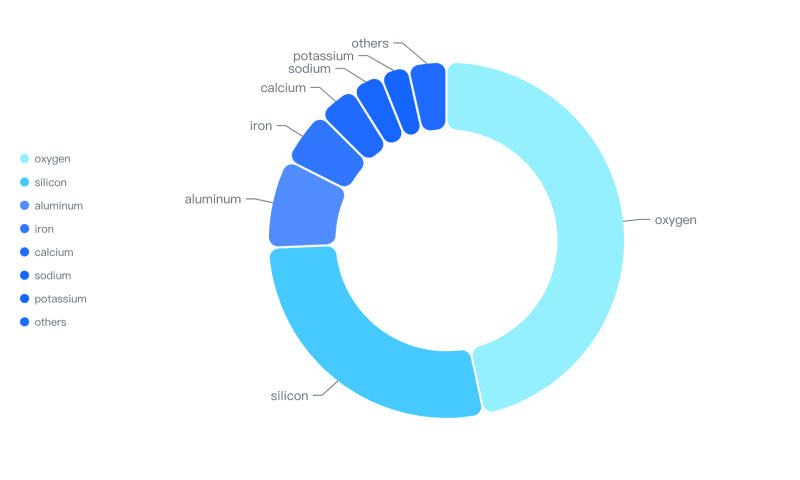
I want to set interpolated gradual change colors for primitive elements with different values, as shown in the example below. The colors of each sector have a difference relationship.
Solution
It can be achieved through custom color mapping.
First, you need to declare the mapping relationship through scales, where id represents the unique index of the mapping, field represents the data mapping field, and color represents the target color of the mapping. You can configure the color palette with interpolation here.
  color: {
    id: 'color',
    type: 'linear',
    range: ['#1664FF', '#B2CFFF', '#1AC6FF', '#94EFFF'],
    domain: [
      {
        dataId: 'id0',
        fields: ['value']
      }
    ]
  },
Secondly, you need to associate mapping in the style of primitive sector. Where scale represents the associated mapping ID, and field represents the data mapping field
fill: {
    scale: 'color',
    field: 'value'
  }
Code Example
const pieData = [
  { type: 'oxygen', value: '46.60' },
  { type: 'silicon', value: '27.72' },
  { type: 'aluminum', value: '8.13' },
  { type: 'iron', value: '5' },
  { type: 'calcium', value: '3.63' },
  { type: 'sodium', value: '2.83' },
  { type: 'potassium', value: '2.59' },
  { type: 'others', value: '3.5' }
];
const spec = {
  type: 'pie',
  data: [
    {
      id: 'id0',
      values: pieData
    }
  ],
  outerRadius: 0.8,
  innerRadius: 0.5,
  padAngle: 0.6,
  valueField: 'value',
  categoryField: 'type',
  color: {
    id: 'color',
    type: 'linear',
    range: ['#1664FF', '#B2CFFF', '#1AC6FF', '#94EFFF'],
    domain: [
      {
        dataId: 'id0',
        fields: ['value']
      }
    ]
  },
  pie: {
    style: {
      cornerRadius: 10,
      fill: {
        scale: 'color',
        field: 'value'
      }
    }
  },
  legends: {
    visible: true,
    orient: 'left',
    data: (data, scale) => {
      return data.map(datum => {
        const pickDatum = pieData.find(pieDatum => pieDatum.type === datum.label);

        datum.shape.fill = scale?.scale?.(pickDatum?.value);
        return datum;
      });
    }
  },
  label: {
    visible: true
  }
};

const vchart = new VChart(spec, { dom: CONTAINER_ID });
vchart.renderSync();

// Just for the convenience of console debugging, DO NOT COPY!
window['vchart'] = vchart;
Results
Online demo::https://www.visactor.io/vchart/demo/pie-chart/linear-color-pie
Related Documentation
Pie Chart Demo: https://www.visactor.io/vchart/demo/pie-chart/linear-color-pie
Related Tutorial:https://www.visactor.io/vchart/guide/tutorial\_docs/Chart\_Concepts/Series/Mark
github:https://github.com/VisActor/VChart


Top comments (0)