As a Front-end web developer, web performance is one of my major responsibilities in our team. I use different tools and methodologies to monitor on a daily basis the performance metrics for our clients.
I have been following closely the SpeedIndex, the First Meaningful Paint, and the Page Load metrics for one of our clients, so when Google released its Web Vitals, I decided to give a better focus to the Largest Contentful Paint (LCP) metric.
One question I was wondering before even starting to measure the LCP was:
What are the consequences on the LCP when the largest element in the viewport is an image that appears with a fade-in animation?
So I measured the LCP of the website I was working on with and without the fade-in animation and I was a little bit surprised by the result: the LCP was exactly the same!
Since I did not understand how that was possible, I decided to investigate a little bit further.
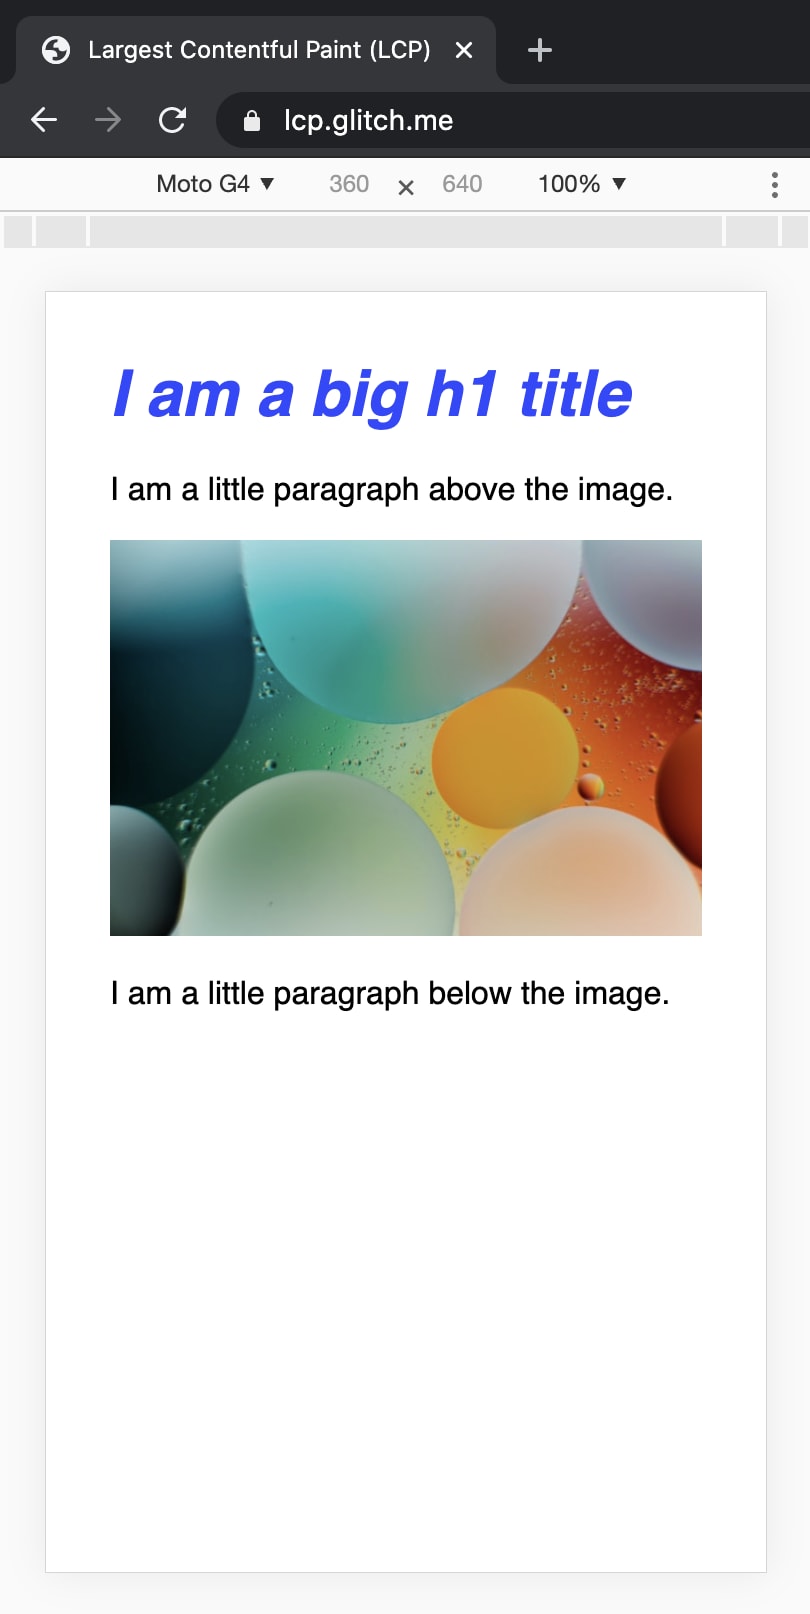
First, I decided to create a simple page with a <h1> title, 2 short paragraphs <p>, and 1 image <img> and made sure the image was the largest element on the page:
I needed to update my lighthouse to version 6 in order to get the Web Vitals metrics:
npm install -g lighthouse@next
Then I ran the performance report on my page:
lighthouse --view https://lcp.glitch.me/
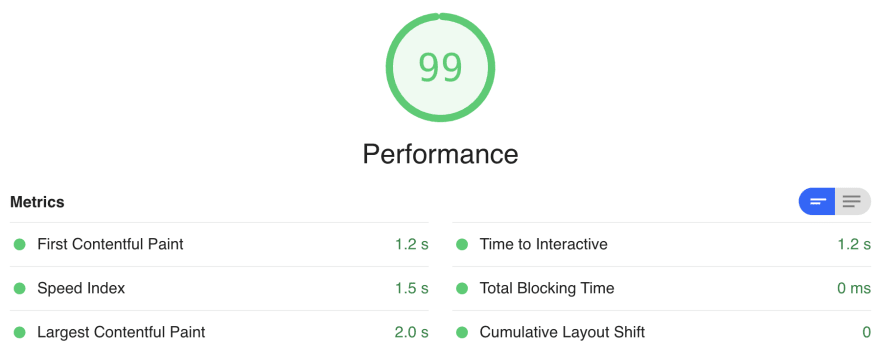
And I got the following results:
I also did a performance audit from the Chrome DevTools tab, and I could see the LCP was triggered when the image was displayed, which was totally fine:
Now I wanted to compare the result with another version of my page including a fade-in animation of 5 seconds and see why I was getting the same result. I added a couple of lines of CSS to implement the animation:
img {
  max-width: 800px;
  width: 100%;
  opacity: 1;
  animation: fadeIn 5s;
}

@keyframes fadeIn {
  from {
    opacity: 0;
  }
  to {
    opacity: 1;
  }
}
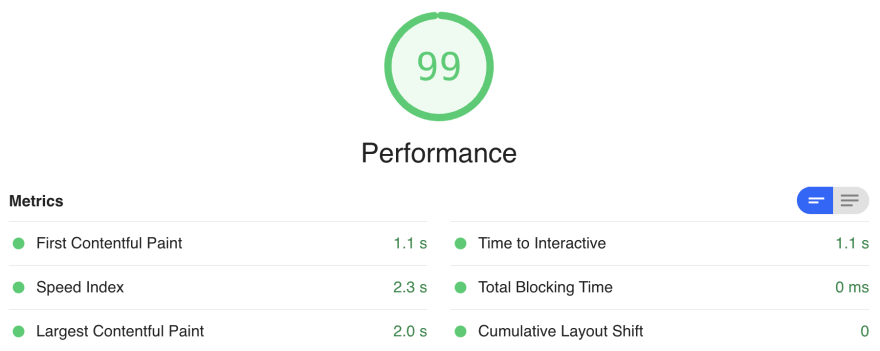
And ran another Lighthouse performance report:
All metrics were the same except the Speed Index, which made sense since this metric “measures how quickly content is visually displayed during page load”. The longer the fade-in animation is, the higher the value will be.
However, how come the LCP is exactly the same?
I did another performance audit with Chrome DevTools and I got the answer to my question:
The LCP was not based on the image anymore but on the h1 title!
So you have to be really careful when using this metric, the LCP is not always tracking the element you think, it’s not always as obvious as it seems to be in the first place :)


Top comments (0)