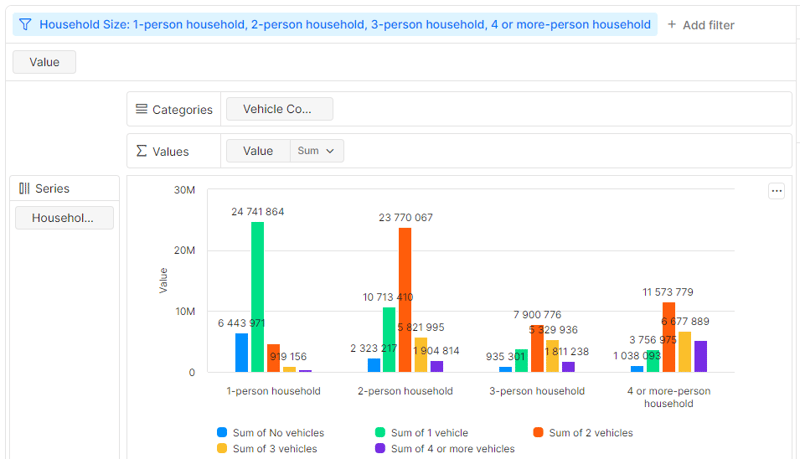
Did you know that the majority of American families own two vehicles? Surprisingly, there are approximately 5 million single-living individuals who own two or more vehicles. Let's dive into these fascinating insights through our Vehicle Ownership public chart.
Exploring numerical data through charts not only offers a visually engaging experience but also taps into our innate ability to process visual information swiftly, as research has shown. Charts provide a clear context and deeper insights into the underlying data compared to traditional numerical formats.
So, how did we create these insightful vehicle ownership charts using Ottava?
We began with our multi-dimensional data stored in an Excel file. You can access similar data from various sources such as the US Census Bureau, Kaggle, and Yahoo Finance, among others.
Once we had our data, we seamlessly transferred it to Ottava's pivot grid with a few simple steps:
- Select the desired data table in Excel using Ctrl-C.
- Navigate to Ottava's pivot grid and click on the dot in the upper-left corner.
- Paste the data using Ctrl-V.
For detailed steps on using Ottava's Smart Copy/Paste.
Voila! Your data is now in Ottava, and the platform automatically suggests suitable charts based on the presented data in the right panel.
You don't need to perform any additional actions; Ottava streamlines the process for you.
If you wish to focus on specific aspects of the data, Ottava offers easy filtering options. For instance, you can select and filter data for 2-person and 3-person households by using Ctrl-click directly in the pivot grid. Ottava then generates corresponding charts, excluding other options.
For further customization or exploration, add the chart to "My View" and tweak it to your preferences.
You can change chart types, apply filters, and rearrange fields effortlessly. Ottava's intuitive interface allows you to swap X and Y axes or modify chart types from bar charts to pie charts seamlessly.
With Ottava, data exploration becomes a breeze. Uncover intriguing insights and discover hidden trends with just a few clicks. Try Ottava today and embark on a journey of data discovery like never before!


Top comments (0)