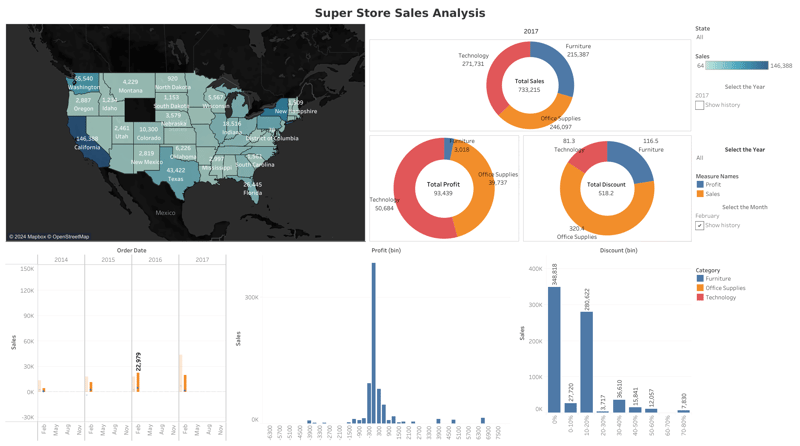
I am excited to share my first Tableau dashboard as part of my data analysis journey. For this project, I used the Superstore sales dataset. With the help of Tableau, I was able to transform complex sales figures into interactive visuals. This allowed me to uncover key insights on sales distribution, profits, and discounts across different categories and states.
🎉 Exploring the data using Tableau has been a very insightful experience. The dashboard features detailed bar graphs that showcase sales figures across different states. In addition, there are pie charts that provide a comprehensive view of profits and discounts. I invite you to check out the dashboard and explore the story behind the numbers. 📊📈✨🔍📉


Top comments (0)