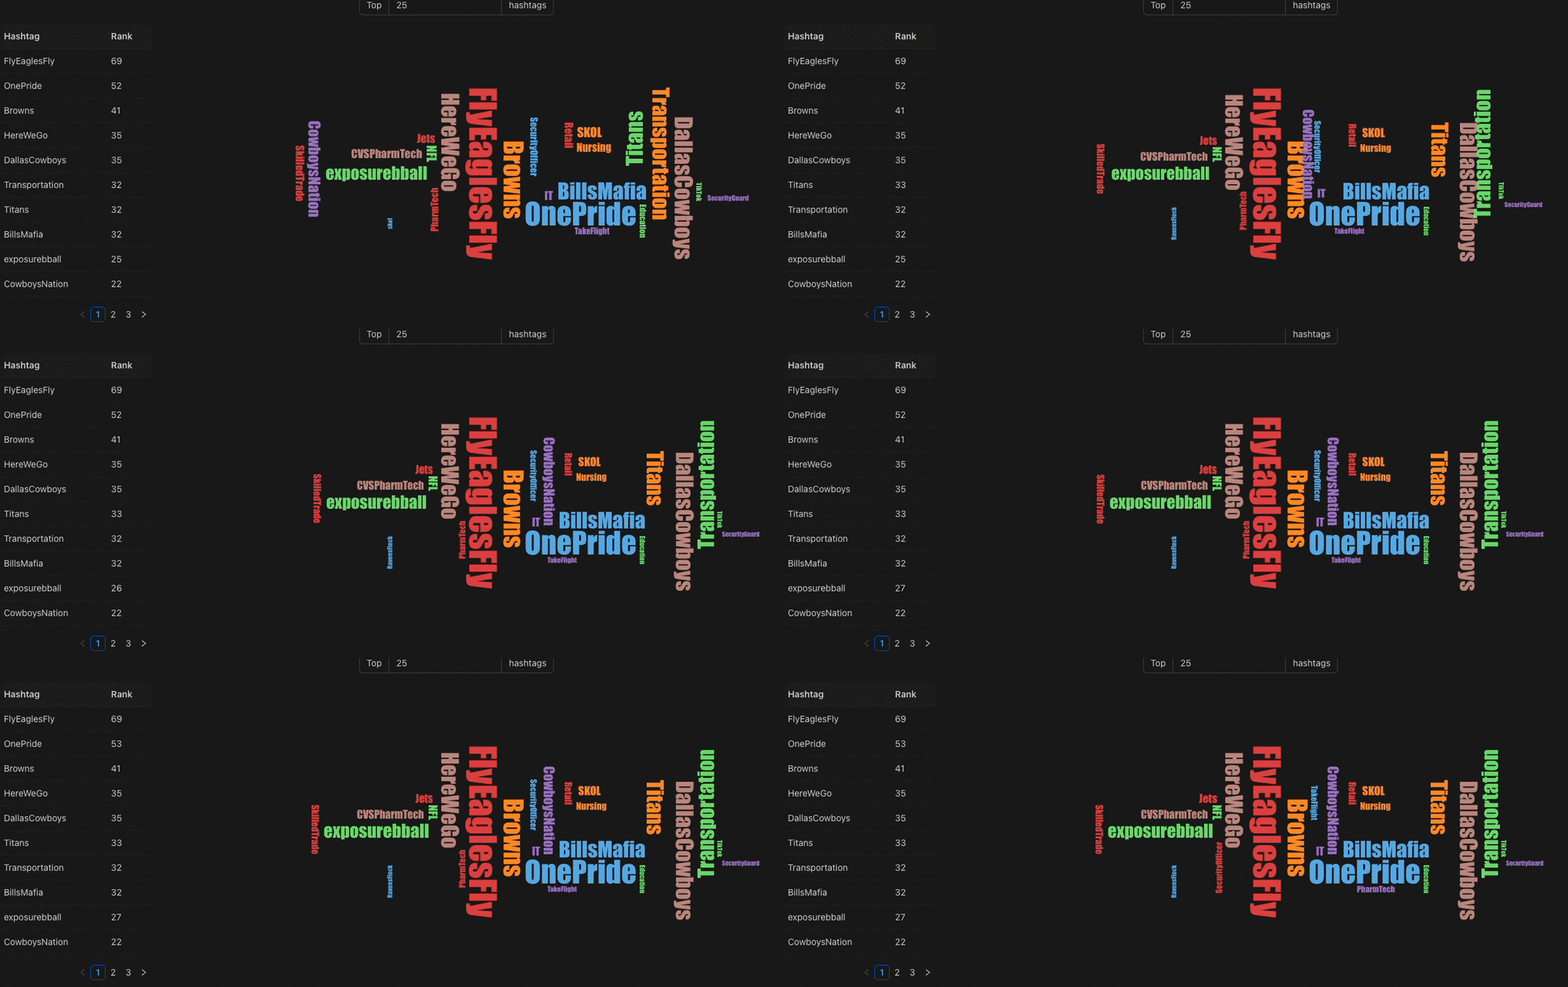
Say you’re tracking the score of the players in your game. To each player name you associate a score. I’d be nice to always know who the top 50 or so players are and to get updates if the ranking changes.
To implement such a feature, we can make use of Redis’ Sorted Set data structure, Pub/Sub and GraphQL subscriptions.
This post dovetails with a previous one, called **Redis as a Database — Live Data Updates With PubSub and GraphQL Subscriptions**, so I highly recommend you check that one out first.
TL;DR
I’m using Visualizer, **my pet project that I’ve talked about it in my previous posts about Redis, to show how to implement a leaderboard . The gist of it is that **Visualizer ingests tweets from Twitter’s v2 API and stores them locally, in a Redis instance. Using the many capabilities of Redis, Visualizer offers a set of nice features, including a leaderboard (though in Visualizer it call it differently).
Algorithm: continuously track the top of the leaderboard, compare the current version with the previous one and publish an update in case that there are differences.
Find the backend code here and the frontend code here.
Ranked Hashtags
In Visualizer, instead of a game leaderboard, I’m tracking all hashtags that are used in the ingested tweets. Hashtags are ranked according to their frequency, i.e. the more they’re used the higher their rank will be. The frontend can subscribe to the top n hashtags with a GraphQL subscription. When there is a change in the top n hashtags, i.e. the rank of some hashtags changes, the frontend will receive an update with the current top n hashtags.
Backend
Both Visualizer API and Visualizer Ingestion are involved in offering an up to date list of the top n hashtags.
Whenever the frontend subscribes to the top n hashtags via a GraphQL subscription, Visualizer API keeps track of the subscription amount and the subscription object.
Meanwhile, Visualizer Ingestion might be ingesting tweets. Every encountered hashtag is first added to the hashtags Sorted Set which automatically ranks it and then the hashtag is published with its new rank in the HashtagRanked Pub/Sub channel.
Back in Visualizer API, every time a ranked hashtag message arrives in the HashtagRanked *channel, every subscriber is updated if necessary. For each subscriber, the key to the Sorted Set containing the previous top *n** hashtags is computed. Then, each PreviousRankedHashtagsForAmount:n Sorted Set is compared with the current top n hashtags from the hashtags Sorted Set. In case a discrepancy between the current top n hashtags and the previous top n hashtags is detected, then the current top n hashtags are published to the GraphQL subscription and the PreviousRankedHashtagsForAmount:n *Sorted Set **is overwritten with the current value.
**Note*: there may be a more efficient way of checking if an update has to be sent out to the subscribers using ZDIFF/ZDIFFSTORE (see all sorted set command), but I haven’t tried. Let me know if you’re interested in that.
To finish the backend part, let’s have a look at the GraphQL subscription definition.
Subscribing to topRankedHashtags is handled in GetRankedHashtagsObservable(…) where _t*weetHashtagService.GetTopRankedHashtagsObservable(amount)* is called, which creates or returns an existing subscription for the requested amount (see the first code gist).
Frontend
Visualizer Frontend uses the excellent Apollo client together with the graphql-codegen to make my life easier when working with a graphQL API.
First, the frontend retrieves the current top n hashtags so that it can display something.
But instead of manually calling this query, graphql-codegen generates a nice little hook that I can call
Next, the frontend subscribes to topRankedHashtags.
Which looks like this with the generated hook
From here on nothing super interesting happens. Whenever new data is available from the subscription, the useTopRankedHashtagsChangedSubscription hook triggers a re-render and the current data is shown in a word cloud — permalink to the whole component https://github.com/mariusmuntean/VisualizerFrontend/blob/8db3b9f1770b9ea74a60ac88fedc4a89c0301e71/src/components/rankedHashtagsChanged/liveRankedHashtags.tsx#L130
So the essence of a feature like a live updating leaderboard is to leverage Redis’ Sorted Sets to get an up to date view of the data and compare it to the previous state.
Thanks for reading. If you liked this post give it a ❤️ and follow me to stay up to date with Redis.


Top comments (0)