
The most obvious thing I always see in the news is, why report daily confirmed and daily deaths? What about normalization for population, demographics, and geospatial effects (and other factors)?
So, I managed to find my own answer, and US and India aren't necessarily number one and number two...
https://rpubs.com/patarapolw/covid19
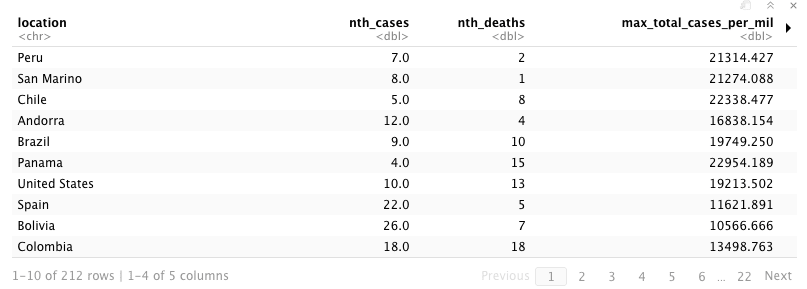
It seems that Peru and Brazil aren't doing well. US isn't that good -- it is within 10th ranking.
However, in this dataset, there are many other collected columns, such as test counts, number of beds, and population densities. So, how do I analyze?
Lastly, I have problems related to R language itself,
- Can I use Jupyter Notebook? -> R-Python-Julia-JavaScript interop
- How do I create GitBook, or something VuePress-like?
- How can my website update every day?
- How can graphs' interactivity be better?

Top comments (1)
The only important values are which exponential curves you're on.