❔ About
Each end of year, managers need to produce a report of the activity to put in perspective the load of the organization.
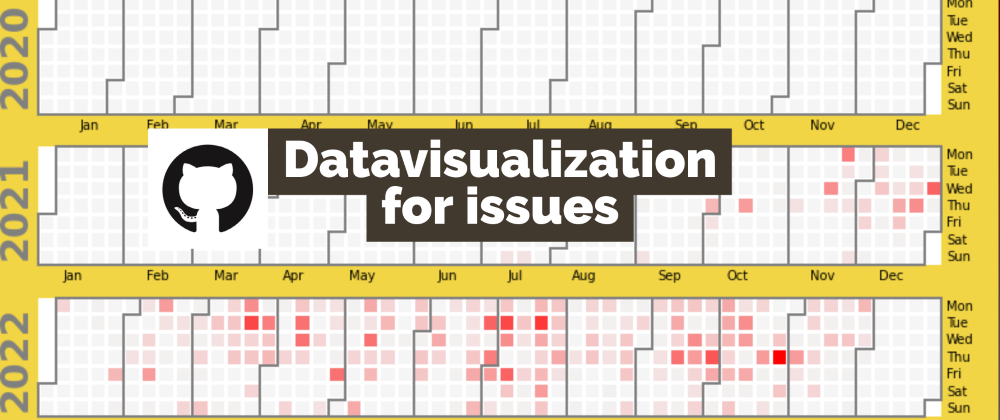
👉 This post will show you some datavisualisations that rely on GitHub issues... as this is, (I want to believe) the item that :
- 👌 Reflects the best our activity
- 🙏 Requires the less effort to be maintained by the team
😭 The hassle of timesheets
🏋️ Daily RUN tagged issues

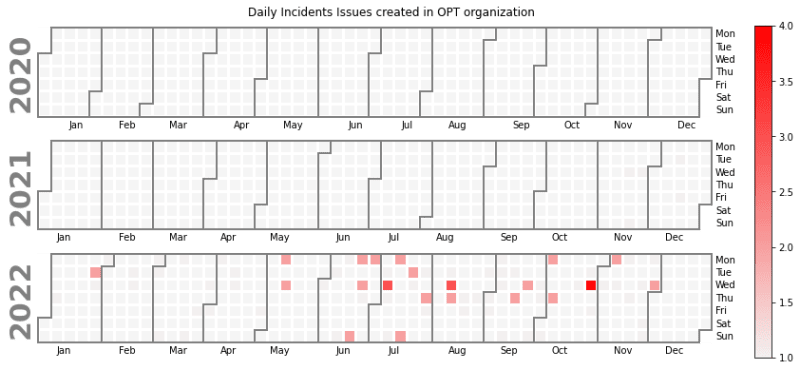
🚨 Daily incidents
🎫 Daily issues

💰 Daily BUILD tagged issues

🐛 Daily bugs

🔖 Resources
🎀 Bonus : GitHub year in review
 GitHub@github
 Our latest article over on @thepracticaldev features 10 fun ways to visualize your contributions. How did your 2022 look? dev.to/github/your-gi…19:45 PM - 09 Jan 2023


Top comments (1)