G2Plot is an interactive and responsive charting library based on the grammar of graphics, which enables users to generate high quality statistical charts through a few lines of code easily.
Moreover, combining with AntV design principles, G2Plot provides standard and elegant visual styles as well as better user experience.
Features
pretty and high-quality charts out of box
G2Plot is powered by an enterprise-class visualization design principle, which not only focuses on the entire visual style of the charting library, but also provides users the best default options for each chart concerning to their own features.
Even though you are not an expert in data visualization, you still can create elegant charts through a few lines of code.

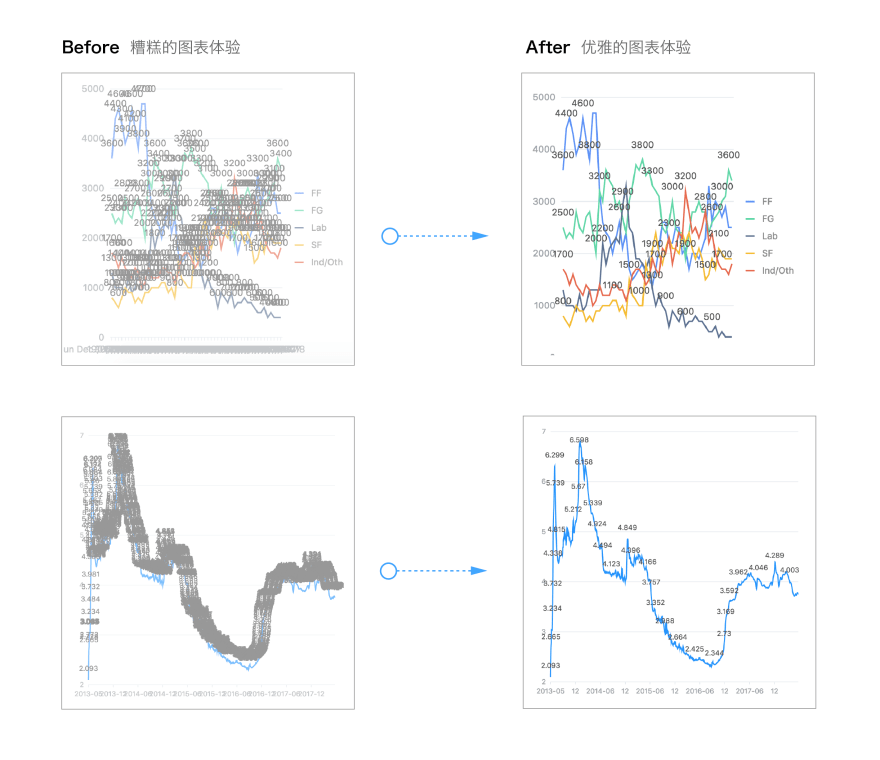
responsive charts
The responsive ability of G2Plot guarantee your chart’s readability and information density in any display space and data status.
story-telling charts
The layer concept in G2Plot provides the possibilities of multi-chart storytelling through the overlapping, combination and connection mode of charts. In addition, G2Plot is exploring the technique of enriching the visual expressiveness of charts, such as transferring statistical chart to infographics.
Installation
$ npm install @antv/g2plot
Usage

<div id="container"></div>
import { Bar } from '@antv/g2plot';

const data = [
  { year: '1951 年', sales: 38 },
  { year: '1952 年', sales: 52 },
  { year: '1956 年', sales: 61 },
  { year: '1957 年', sales: 145 },
  { year: '1958 年', sales: 48 },
];

const bar = new Bar(document.getElementById('container'), {
  data,
  xField: 'sales',
  yField: 'year',
  colorField: 'year',
});

bar.render();
Development
$ npm install

# run test case
$ npm run test

# run demos
$ npm start

Top comments (0)