After the last blog post, you should now have a working Kubernetes cluster!
First of all, congrats!
I'm sure your next question is regarding monitoring, and you would be right. We have a brand new playground, but if something goes wrong, we won't really know why.
This article will be an introduction to all the tools I would recommend, you won't see code in here (the article would be way too long). The tutorial part will come later.
Application logs
The first type of monitoring would be the application logs. Are requests successful? Who is making that request?
I personally use Azure App insights (as it's not very pricey plus you have a free tier), but feel free to look at others.
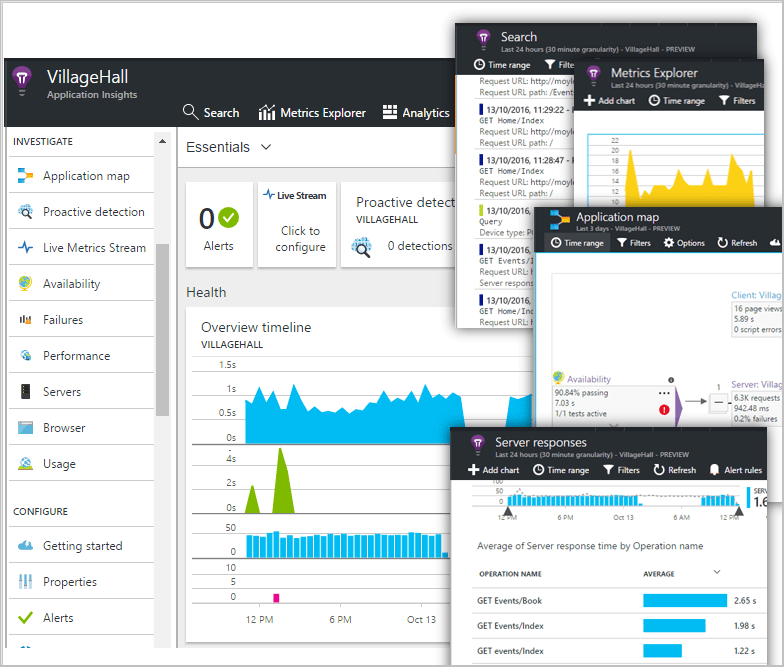
You install a small SDK in your app, and bam, you're sending the telemetry data to Azure.
You can instrument not only the web service application, but also any background components, and the JavaScript in the web pages themselves. The application and its components can run anywhere - it doesn't have to be hosted in Azure.
I know AWS has some logs for apps as well, but I personally haven't used them.
Infrastructure
This part will be seen in more details in future articles.
The usual combination for Kubernetes infra is Prometheus + Grafana + service mesh.
Prometheus + Grafana
Prometheus is a data collector, and you can add alertmanager on top to send you alerts when things are not going exactly the way they should. Prometheus will pull the metrics from your system, which will not add load to it.
You can integrate AWS cloud watch metrics to be collected by Prometheus as well, as you will surely be using other AWS services (for example, RDS).
Grafana is the nice UI you usually see with Prometheus tutorials.

Service mesh
We personally use Linkerd as it was so easy to install (2h top), and we didn't need any of the 'fancy' ISTIO was promising.
By default, Linkerd stores metrics internally in prometheus style, on an internal Prometheus database. It is easy to add your own centralised Prometheus server, which is something you might want to consider as Linkerd only keeps metrics for 6hours (more here ).
You can as well add a standalone grafana to it.
If you need to change the default configuration, it is possible, just a tad more work (I wanted to mention it, although I wouldn't expect first-time beginners to do this!).
I will as well add that it is a quite new product (the first PR was in December 2017) so there are some things missing - or that could be done better. The team is quite helpful and quick to answer, so don't hesitate to ping them if needed.
With all those, you should have all the keys to identify problems related to your cluster. Obviously, if you haven't worked with Kubernetes before, you will find yourself looking at logs for a long time - and this is fine!
I realise this is a very short article - and to be honest, my goal is not to re-explain documentation that can be found online (for example, Linkerd has a whole page explaining how they work).
I intend to write a couple of article regarding monitoring (alertmanager, for example). Is there anything that you would like more details on? 😊
See you in the next article!

Oldest comments (0)