Profiling is very important to improve the performance
What is Profiling?
The meaning of Profiling is that collecting and compiling the information of status of systems performance.
Why is Profiling important?
To improve the performance of systems, we have to detect the bottleneck of them.
For example, bottlenecks are N+1 problem of SQL, low-cpu-consuming, no index of tables in Databases, and so on...

The flow of general web systems is shown above.
Clients (PC, mobile,..) send requests to the system, and the web system processes them.
Throughput and latency are one of the metrics which expresses the performance.
Throughput is the number of requests processed per second.
And latency is the time to process one request.
The throughput varies system to system and the throughput of the whole system is limited by the minimum throughput.
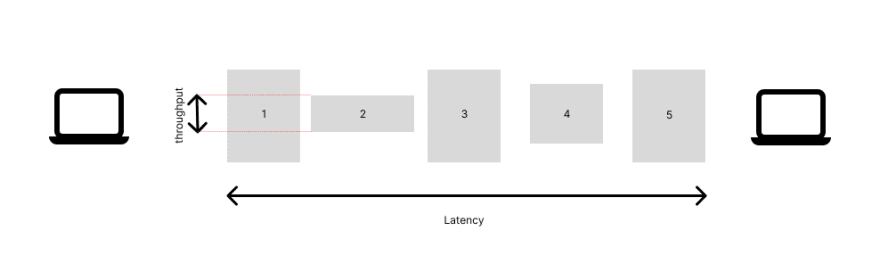
So, above image shows that the throughput of the system is limited by that of 2.
This teaches us the important thing.
We cannot improve the system by improving the elements which are not the bottleneck.

If we improve the element 4, we still cannot make the performance of the system better.
How to profile?
There are 3 steps for it.
- load testing with bench markers
- record logs
- compiling the logs and calculating the stats
load testing
We can mock many requests by users with bench markers.
There are many ways to do this, but in this article, I introduce two ways.
One is ab command and the other is k6.
ab command
https://github.com/CloudFundoo/ApacheBench-ab
By using this command, we can simply send many requests to one api endpoint and get the simple stats as shown below.
This is ApacheBench, Version 2.3 <$Revision: 1879490 $>
Copyright 1996 Adam Twiss, Zeus Technology Ltd, http://www.zeustech.net/
Licensed to The Apache Software Foundation, http://www.apache.org/

Benchmarking localhost (be patient).....done


Server Software:        nginx/1.22.0
Server Hostname:        localhost
Server Port:            80

Document Path:          /
Document Length:        35644 bytes

Concurrency Level:      1
Time taken for tests:   7.388 seconds
Complete requests:      10
Failed requests:        0
Total transferred:      360070 bytes
HTML transferred:       356440 bytes
Requests per second:    1.35 [#/sec] (mean)
Time per request:       738.809 [ms] (mean) # latency
Time per request:       738.809 [ms] (mean, across all concurrent requests)
Transfer rate:          47.59 [Kbytes/sec] received

Connection Times (ms)
              min  mean[+/-sd] median   max
Connect:        0    0   0.0      0       0
Processing:   728  739  28.5    730     820
Waiting:      727  737  28.0    729     817
Total:        728  739  28.5    730     820

Percentage of the requests served within a certain time (ms)
  50%    730
  66%    730
  75%    732
  80%    732
  90%    820
  95%    820
  98%    820
  99%    820
 100%    820 (longest request)
k6
ab command is also useful but, the requests our system receives are more complicate and the parts of the user story.
So, if you want to simulate more realistic requests, we can use k6.
k6 is one of OSS managing load testing.
We can easily imitate user stories by writing
scenario files.
record logs
We have to record system logs for next step.
In this article, I introduce how to record the logs of nginx and mysql.
nginx log
We can record api access log by modifying a configuration file /etc/nginx/nginx.conf like below.
log_format json escape=json '{"time":"$time_iso8601",'
                            '"host":"$remote_addr",'
                            '"port":$remote_port,'
                            '"method":"$request_method",'
                            '"uri":"$request_uri",'
                            '"status":"$status",'
                            '"body_bytes":$body_bytes_sent,'
                            '"referer":"$http_referer",'
                            '"ua":"$http_user_agent",'
                            '"request_time":"$request_time",'
                            '"response_time":"$upstream_response_time"}';
server {
  access_log /var/log/nginx/access.log json;
  listen 80;

  client_max_body_size 10m;
  root /public/;

  location / {
    proxy_set_header Host $host;
    proxy_pass http://app:8080;
  }
}
and then we can get an access log file in /var/log/nginx/ like this.
{"time":"2022-06-29T03:37:40+00:00","host":"172.25.0.1","port":60820,"method":"GET","uri":"/","status":"200","body_bytes":35644,"referer":"","ua":"ApacheBench/2.3","request_time":"6.020","response_time":"6.020"}
{"time":"2022-06-29T03:37:41+00:00","host":"172.25.0.1","port":60830,"method":"GET","uri":"/","status":"200","body_bytes":35644,"referer":"","ua":"ApacheBench/2.3","request_time":"0.982","response_time":"0.981"}
{"time":"2022-06-29T03:37:42+00:00","host":"172.25.0.1","port":60836,"method":"GET","uri":"/","status":"200","body_bytes":35644,"referer":"","ua":"ApacheBench/2.3","request_time":"0.906","response_time":"0.905"}
{"time":"2022-06-29T03:37:43+00:00","host":"172.25.0.1","port":60842,"method":"GET","uri":"/","status":"200","body_bytes":35644,"referer":"","ua":"ApacheBench/2.3","request_time":"1.037","response_time":"1.037"}
{"time":"2022-06-29T03:37:44+00:00","host":"172.25.0.1","port":60848,"method":"GET","uri":"/","status":"200","body_bytes":35644,"referer":"","ua":"ApacheBench/2.3","request_time":"1.025","response_time":"1.025"}
{"time":"2022-06-29T05:55:51+00:00","host":"172.25.0.1","port":60854,"method":"GET","uri":"/","status":"200","body_bytes":35644,"referer":"","ua":"ApacheBench/2.3","request_time":"1.078","response_time":"1.077"}
{"time":"2022-06-29T05:55:52+00:00","host":"172.25.0.1","port":60860,"method":"GET","uri":"/","status":"200","body_bytes":35644,"referer":"","ua":"ApacheBench/2.3","request_time":"0.996","response_time":"0.996"}
{"time":"2022-06-29T05:55:53+00:00","host":"172.25.0.1","port":60866,"method":"GET","uri":"/","status":"200","body_bytes":35644,"referer":"","ua":"ApacheBench/2.3","request_time":"0.995","response_time":"0.994"}
{"time":"2022-06-29T05:55:54+00:00","host":"172.25.0.1","port":60872,"method":"GET","uri":"/","status":"200","body_bytes":35644,"referer":"","ua":"ApacheBench/2.3","request_time":"0.992","response_time":"0.992"}
{"time":"2022-06-29T05:55:55+00:00","host":"172.25.0.1","port":60878,"method":"GET","uri":"/","status":"200","body_bytes":35644,"referer":"","ua":"ApacheBench/2.3","request_time":"0.987","response_time":"0.987"}
slow query log for mysql
Mysql can record the logs of queries.
We can know many things(how long does it take to execute a query?, how many times is each query called? ...) from that logs.
We can modify the configuration file /etc/my.cnf like below.
[mysqld]
default_authentication_plugin=mysql_native_password

slow_query_log = 1
slow_query_log_file = /var/log/mysql/mysql-slow.log
long_query_time = 0
long_query_time is the threshold omitting or not.
If long_query_time is 1, we can record only the logs of the high-time-consuming queries, taking longer than 1 sec.
But, low-time-consuming queries can be also a problem, so first, I recommend you to specify it to 0.
For example, the system calls the same low-cost queries many times and it leads to the increase of latency.
compiling the logs and calculating the stats
This is the last step of profiling.
alp
https://github.com/tkuchiki/alp
alp is one of the access profilers.
we can easily check the stats of endpoints like below.
In this case, I only mock requests to the root path and the result show only one line, but if we imitate the user actions and execute load testing, we can get to know which endpoint is the bottleneck for our web system.
+-------+-----+-----+-----+-----+-----+--------+-----+-------+--------+---------+-------+-------+-------+-------+--------+-----------+-----------+-------------+-----------+
| COUNT | 1XX | 2XX | 3XX | 4XX | 5XX | METHOD | URI |  MIN  |  MAX   |   SUM   |  AVG  |  P90  |  P95  |  P99  | STDDEV | MIN(BODY) | MAX(BODY) |  SUM(BODY)  | AVG(BODY) |
+-------+-----+-----+-----+-----+-----+--------+-----+-------+--------+---------+-------+-------+-------+-------+--------+-----------+-----------+-------------+-----------+
|   189 |   0 | 188 |   0 |   1 |   0 | GET    | /   | 0.597 | 10.951 | 160.983 | 0.852 | 0.772 | 0.987 | 6.020 |  0.908 | 35644.000 | 35644.000 | 6701072.000 | 35455.407 |
+-------+-----+-----+-----+-----+-----+--------+-----+-------+--------+---------+-------+-------+-------+-------+--------+-----------+-----------+-------------+-----------+
mysqldumpslow
mysqldumpslow is the profiler for mysql slow queries.
We can identify which query has a bad impact on the system.
continuous profiling is the key to more improving
In this article, I show you way of thinking about improving the performance of web systems and how to do it.
Finally, I want to say that continuous profiling is very important for more improving.
This is because, after you modify the bottleneck and it works, the bottleneck moves to another part. This shows that we have to improve that part next.

If you remove the bottleneck, improving the performance of 2, the bottleneck moves to 4.

So, in order to improve the performance more, we have to do profiling continuously, and catch up the bottleneck!
Thank you.

Top comments (0)