Outliers
An outlier is an observation which deviates so much from the other observations as to arouse suspicions that it was generated by a different mechanism ~ Hawkins 1980
An anomaly, also known as an outlier, is a rare-event data point or pattern which does not conform the the notion of normal behaviour. An object in a data set is usually called an outlier if:
- It deviates from the known/normal behaviour of the data
- The point is far away from the expected/average value off data or
- It is not connected/similar to any other object in terms off its characteristics
Anomaly Detection is the process of flagging unusual cases in data, and spans multiple industries across multiple types of data.
This may seem like a trivial task, however humans have evolved to perform pattern-recognition at levels which far surpass even the most complex machine-learning model which exists today. We can differentiate betweeen the expected variance in data and outliers after having only seen a small number of normal instances (an infant is able to differentiate its biological parents from relatives before the age of 1 after exposure to only two humans, that's one heck of a cold-start performance metric)
The property which defines an outlier may be attributed to various properties of the data, and each property may lead to a specific characterization of outliers.
Classifying Outliers
Size-Based
An outlier can quantitatively correspond to the size of a data neighbourhood. For example, according to network theory, the degree of distribution of social networks typically follows a power-law. In other terms, the number of nodes with degree (number of connections) is proportional to . A community made up of a collection of nodes (persons) all with the same degree, for a sufficiently large number of persons, can be thought of an outlier, or anomalous community, as it does not follow the expected size-related pattern.
Diversity Based
Outliers may be classified based on how different they are, generally speaking, to other data points. For example, if a search-engine optimizes its results according to how fast a website loads (yes it's dumb but bare with me), then a page with a significantly faster-loading behaviour compared to others can get a better ranking. Here, incredibly fast-loading websites, such as static pages, can adversely affect the rankings of search engines.
Applications of Anomaly Detection
Network Intrusion Detection
This is mainly applicable to time-series and graph-based data. Network security is of paramount importance, and the rise of cyber-attacks (such as DDoS, etc) has continued to cement the need for robust detection and response to these types of attacks. This is particularly challenging, since an anomaly detection system must be able to partially differentiate between an actual anomalous event and some other non-anomalous, high-traffic event such as a new product release (such as when Google's online store went down for the launch of its Pixel 6).
Medical Diagnosis
ECGs, MRIs and simpler readouts such as glucose and oximetry readouts directly or indirectly indicate individuals' health status. This can be a potentially life-or-death application of anomaly detection, and is further complicated by the low-latency need of such a system.
Industrial Visual Defect Classification
This application uses anomaly detection for (in my opinion) its second most immediately-tangible application yet. Measurements from various sensors and cameras are used as input into an anomaly-detection system as a form of quality-assurance. This is another challenging area, as defects can vary from subtle changes such as thin scratches to larger structural defects like missing components.
The Sciences
A black-hole is an anomaly from our perspective. We only recently managed to get a decent image of what was previously strictly theorized. Even Einsten himself did not believe in its existence. Anomaly detection systems can be used to detect previously-unseen physical phenomena, such as in parsing the input from out-of-visible-light telescopes or to detect genetic mutations in DNA.
Feature Selection
This is possibly the most difficult part of building an anomaly detetion system, owing to its unsupervised nature. A common way of measuring the non-uniformity of a set of univariate points is the Kurtosis measure. The data is standardized to zero mean and unit variance. The resultant data points are raised to the fourth power, following by summation and normalization

Types of Kurtosis
Feature distributions that are highly non-uniform exhibit a high-level of Kurtosis, for example when the data contains a few extreme values, the Kurtosis measure tends to increase owing to the use of the fourth power. Features may then be selected based on its level of Kurtosis as a learning algorithm may better differentiate non-anomalous points from actual hazards.
Approaches to Anomaly Detection
Extreme-Value Analysis
This is the most widely used knowledge-based method. A decision-tree -type structure is used to classify data into anomalous or not. This is different from the classification approach, as these rules are hand-defined and hardcoded into the algorithm.
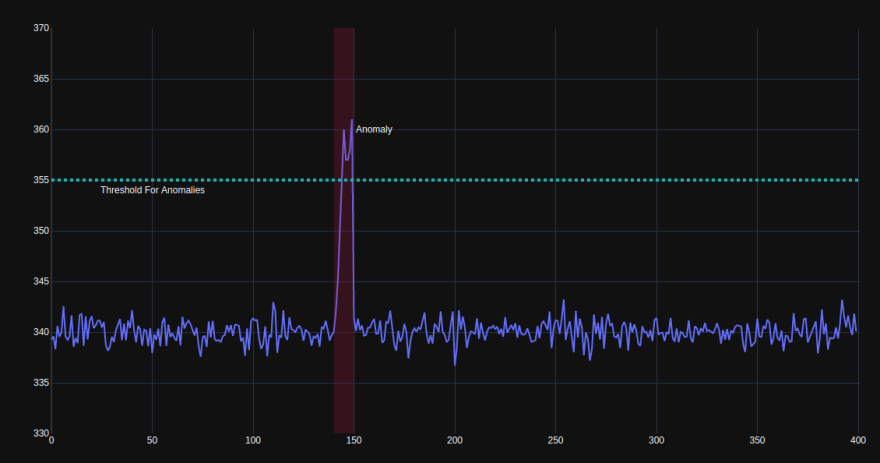
An even simpler approach would assign specific thresholds to data values and simply report anomalies when the data crosses this threshold. This system is the least flexible and is not able to learn with new data, or adapt to different data distributions. It is however, very simple to set up and highly interpretable, as the overall structure is defined beforehand.
Statistical Techniques
This approach assumes that data follows a specific distribution. The most basic form computes parameters of a probability density function for each known class of network traffic, and tests unknown samples to determine to which class it belongs.
In most network-based time-series applications, the Gaussian distribution is used to model each class of data, however other approaches such as Association Rule mining (counting the co-occurrences of items in transactions) has been used for one-class anomaly detection by generating rules from the data in an unsupervised fashion.
As a Supervised Classification Task
An algorithm learns a function mapping input features to outputs based on example input-output pairs. The goal is to reframe anomaly detection as a binary classification task (either an anomaly or not). However, owing to the incredibly skewed data distribution (remember, by definition an anomaly is rare), each anomaly is potentially highly underrepresented. Additionally, there may be many types of anomalies (an aircraft engine can under-perform by either spinning too slowly or by catastrophically exploding, both of which can potentially lead to hazardous situations for vastly different reasons). This further leads to sparsity and intense skews in the data used to train these models.
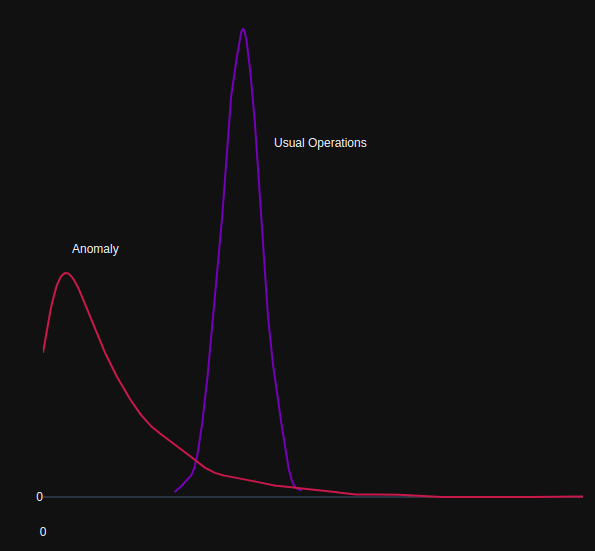
Unsupervised Proximity-Based Learning

In the above, the group , or *cluster of points represents normal operation, whilst the three to the bottom-left can be considered anomalous*
Since labeled anomalous data is rare, unsupervised approaches tend to be more popular than supervised ones in anomaly detection. This is where no input-output pairs are readily available for training, but the algorithm learns what is 'normal' over time, and reports anything which deviates to some degree from the usual data distribution. The caveat here is that many anomalies may correspond to noise, or may not be of interest to the task at hand. The acutal approach used for this sort of unsupervised learning may vary wildly. For example, in detection anomalous events from video, an algorithm may predict the next video frame, and compare the actual video frame to the predicted. The deviation from predicted and actual may then be thresholded in order to classify frames as positive/negative anomalies.
Information Theoretic Models
The idea behind this approach is that outliers increase the minimum-code-length (MDL) required to describe the data set, because they represent deviations from natural attemps to summarize thd data. The following example, taken from Outlier Analysis, describes this idea.
Consider the following two strings:
ABABABABABABABABABABABABABABABABAB
ABABACABABABABABABABABABABABABABAB
The second string is the first length as the first, different only at a single positions containing the unique symbol 'C'. The first string can be concisely described as "AB 17 times", whilst the second scring can not be described in the same manner (additional description is need to account for 'C'). These models are closely related to conventionaly models, in that they learn a concise representation of the data as a baseline for comparison.
Semi-Supervised Learning
This is a hybrid approach using both labelled and unlabelled data. This hybrid approach is well suited to applications like network intrusion detection, where one may have multiple examples of the normal class and some examples of intrusion classes, but new kinds of intrusions may arise over time.
Another idea is based on initializing a neural network with pre-trained weights and then improving by adaptation to training data. This is a relatively new concept, and has not begun to see much advanced research. This approach might include training an auto-encoder on normal data, and then using the encoder on previously unseen data. The difference between encoded features from the usual data distribution can then be used to indicate the presence of an anomaly.
Evaluation Criteria
By definition, anomaly detection expects that the distribution between normal and abnormal data classes may be highly skewed, and is known as the class imbalance problem. Models which learn from this type of data may not be robust, as they tend to perform poorly when attempting to class anomalous examples. For example, imagine trying to classify 1000 time-series snippets representing web-traffic for your website, 950 of which are typical, everyday usage patterns. Any algorithm which classifies all of your data samples as normal (non-anomalous), immediately achieves accuracy! In other terms, a simple rule, 'return negative' appears to perform remarkably well. The issue here is that the anomalous class is under-represented, an the accuracy metric does not account for this
Based on the prior argument, we must conclude that using Accuracy alone may not be suitable for adequately evaluating an anomaly-detection system. This is where we move forward with more intentional measures.
Precision and Recall
Precision gives an idea of the ratio between correct predictions (true positives) and the sum of all predictions that returned as true (true positives plus false positives). An algorithm which optimizes strictly for precision is less concerned about false negatives, and is instead optimized for extreme confidence in its positive predictions.
Recall gives the ratio of correct predictions (true positives) so the sum of all true data points (true positives plus false negatives). This metric, also known as sensitivy, can give a more balanced idea of how well an algorithm is at detecting positive samples. For example, the recall in our "return all false" model will be zero, as the numbeer of true-positives (correct predictions) will also be zero. Optimizing for recall may be more appropriate when the cost of false-negative may be very high, for example in an airport security system, where it is better to flag many items for human inspection as opposed to accidentally allowing dangerous items onto a flight.
Hopefully you should have a general understanding of what anomaly detection is, why it's useful, a few challenges in the field and a few ways of framing anomaly-detection problems. In my next few posts, I'd be delving into anomaly detection models in-detail, and walking through some Python in how to implement some of these anomaly detection models

Top comments (0)