Application teams must understand what their customer experience is like. This is true not only from a general perspective (in terms of usability and responsiveness) but also on a day-to-day, minute-by-minute basis.
In particular, when you work with distributed systems, errors are inevitable. Site traffic fluctuates throughout the day, and any one of a system’s dependencies could also encounter an issue at any time.
In this article, we'll use magic dashboards to help monitor and resolve performance issues within a Ruby on Rails application.
But before we dive into magic dashboards, let's see what we should look out for when designing our apps.
Things to Consider When Building A Ruby App
As an application owner or team member, you'll want to know if there are any problems with your application before the customer does. This enables you to take corrective action immediately and hopefully avoid any disruption to your users.
There are a few key application questions you need to be able to answer at any point in time:
- Is the page response time acceptable? According to Google, these days anything slower than two seconds will cause customers to leave your site and go elsewhere.
- Are your users experiencing any errors? If so, what types of errors? What is the error rate?
- Are any ongoing operational issues affecting your application? This could be with the network, storage, or security services. As we all know, cloud providers have outages that impact our application’s health as well.
Observability is key, yet it is often the last thing engineers think about. Besides, there is already time built into the schedule for operational readiness. It's called the weekend before the product launch!
Joking aside, you have to build your app first before something exists to be observed. This lends itself to delaying performance testing until close to the end of the development lifecycle. You don’t want to spend too much time performance testing when the product isn’t code-complete, because then you’ll have to do it all over again later.
The same is true for security testing. If you conduct it too early, a vulnerability could still be introduced after testing, but before a product goes into production.
So, we know monitoring is critical, but all of these concerns are fair points. Monitoring doesn’t get the attention it deserves until late in the process. That’s why AppSignal created magic dashboards.
Magic Dashboards in AppSignal
AppSignal understands the importance of metrics, dashboards, and your app's performance — but also that engineers have minimal time to work on these before launch.
Our magic dashboards are called "magic" because the metrics collection and associated dashboards are created automatically for you, simply when you connect your app and integrated components.
Magic Dashboards: An Example Ruby on Rails App
Let's find out how we can monitor and resolve performance issues within a Ruby on Rails app using magic dashboards.
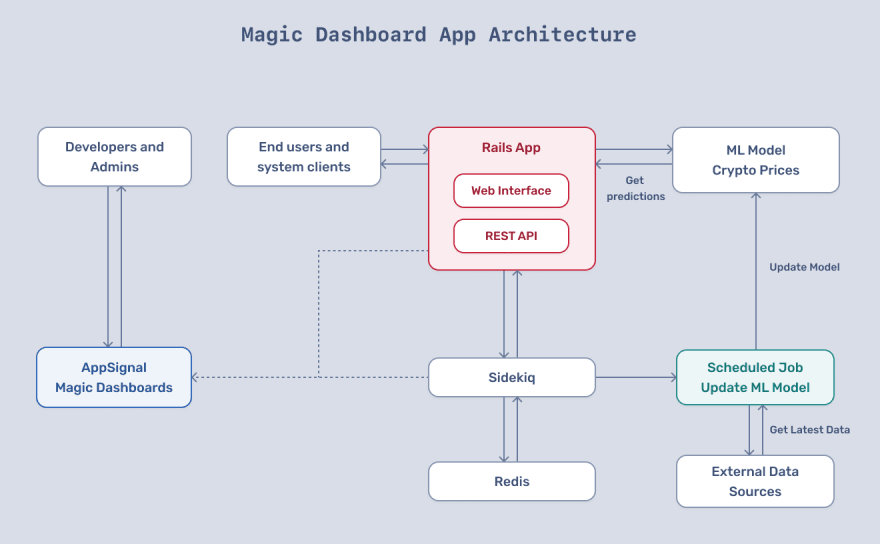
Our application uses a simple machine learning (ML) model for cryptocurrency price prediction. An asynchronous job updates the model daily with the latest price data and improves accuracy over time. This Rails app has both web pages and a REST API, as shown in the architecture diagram below.
After we deploy our Rails app, magic dashboards are automatically created for the Rails Puma web server and the Sidekiq asynchronous jobs. Other supported integrations for magic dashboards include MongoDB and the Erlang VM.
You can use the Puma magic dashboard to evaluate performance based on threads, pool capacity, and puma workers. The Sidekiq magic dashboard monitors queue length, queue latency, job duration, job status, and memory usage.
Magic dashboards are detected and created based on the use of event-based metrics such as a Sidekiq job run, as well as minutely probes. The minutely probe feature allows you to register a Ruby block or class to send custom metrics to AppSignal. Magic dashboards provide out-of-the-box integration for supported components, but you can leverage this mechanism to send your custom metrics to AppSignal.
An Example of Custom Minutely Probes
Sidekiq integration is already built in, but imagine you want to monitor a proprietary background job mechanism. You can use the following class example. The probe class obtains a connection that is then used on each call to get the desired metrics.
# config/initializers/appsignal.rb or a file that's loaded on boot

# Creating a probe using a Ruby class
class BackgroundJobLibraryProbe
  def initialize
    # This is only called when the minutely probe gets initialized
    require "background_job_library"
    @connection = BackgroundJobLibrary.connection
  end

  def call
    stats = @connection.fetch_queue_stats
    Appsignal.set_gauge "background_job_library_queue_length", stats.queue_length
    Appsignal.set_gauge "background_job_library_processed_jobs", stats.processed_jobs
  end
end

# Registering a Class probe
Appsignal::Minutely.probes.register(
  :background_job_library_probe, BackgroundJobLibraryProbe
)
The call to Appsignal::Minutely.probes.register takes two parameters — a name for the probe and its implementation, which can be either a lambda or a class that implements the call method.
Configuration and System Requirements for AppSignal
Simply use AppSignal with your Rails application to get magic dashboards. If you haven’t already installed AppSignal, include the appsignal gem in your Gemfile and run a bundle install.
gem 'appsignal'
Then run the appsignal install command to configure your environment. This configuration can be stored in a config file or environment variables, and connects your application to your AppSignal account and dashboards.
bundle exec appsignal install appsignal-license-key
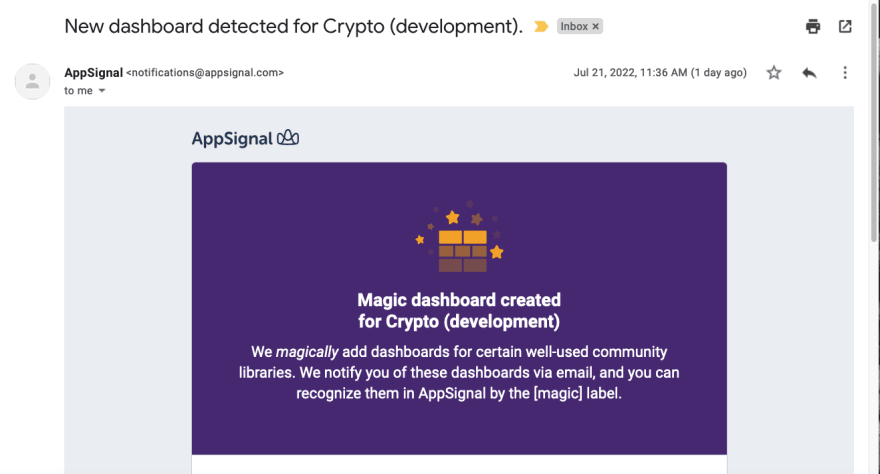
After you install and run your server, you will see a few emails similar to the following.
The system requirements for this example are:
- AppSignal gem 2.9.0 or higher, which includes support for the minutely probe.
- Puma integration - requires version 3.11.4 or higher.
- Sidekiq integration - requires the Redis gem 3.3.5 or higher. For this integration, the AppSignal gem 2.9.5 or higher is recommended.
Performance Testing our Price Prediction API
The above example application uses a simple neural network implemented using the Ruby FANN gem to predict the next day's Bitcoin price. Percentage price changes from the last ten days are used as inputs to the model.
The REST API doesn't take any parameters, as it currently only predicts the price for tomorrow. The output is a simple JSON document, as shown below.
http://localhost:3000/crypto/predict_api

{
  "day":"2022-07-22",
  "price":23080.95619
}
A Sidekiq job gets the market price at the beginning of each day and updates the ML model. This job is scheduled to run every five minutes, enabling it to catch up to any outages or errors quickly.
You can find all of the code from this article on GitHub. Please note that nothing in this article or the software constitutes investment advice. Consult a financial advisor before making any investment decisions regarding cryptocurrency.
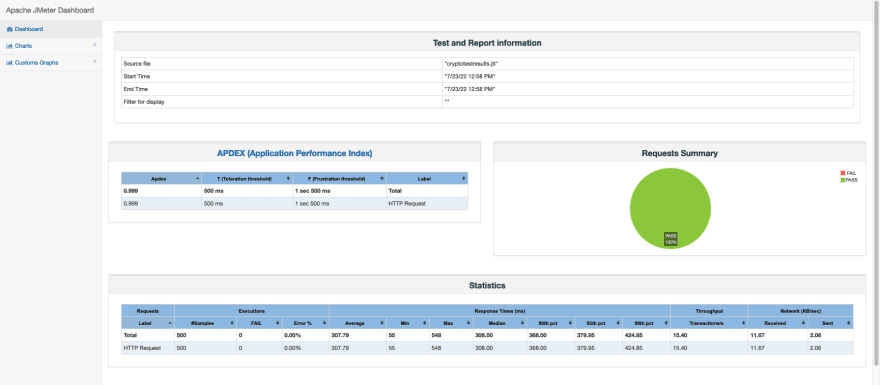
We'll use JMeter to simulate load on the REST API for performance testing. This allows us to generate traffic and evaluate performance using our magic dashboards. Our first test uses 5 concurrent clients, each making 100 requests.
The statistics show a fairly high range in response time, with an average of 342ms, but the P99 is 852ms. It seems that we can do better.
Improving Rails App Performance with the Puma Magic Dashboard
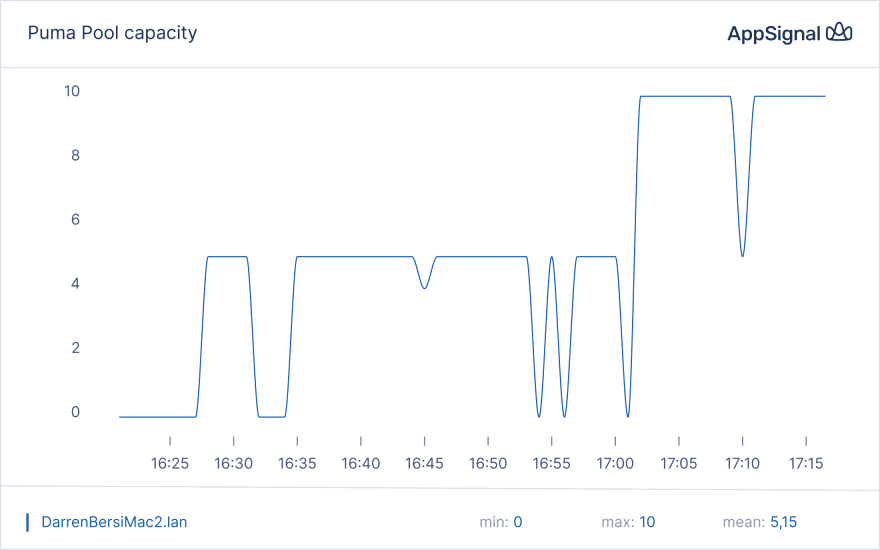
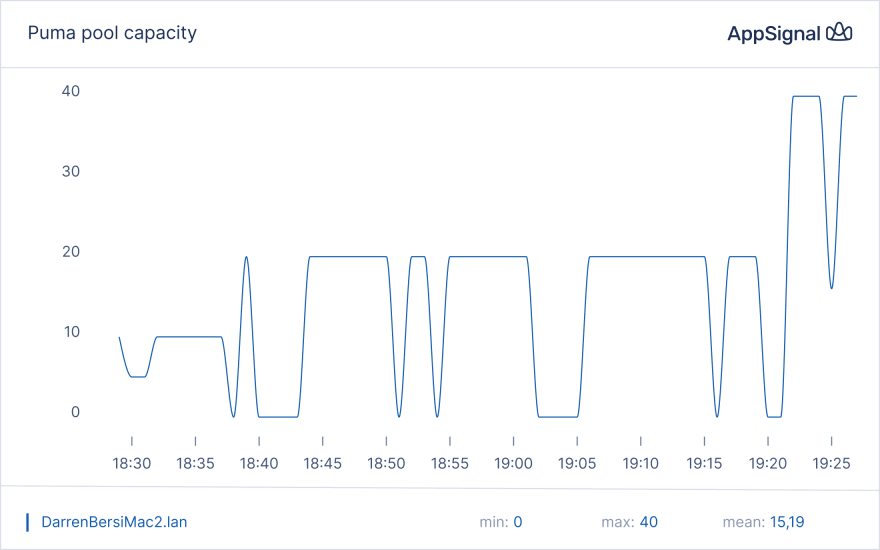
Our Puma magic dashboard includes a graph of the thread pool capacity, and we can see that it touches zero during our test run. This would explain why some requests take longer than others, so we'll increase the number of puma threads to 10.
Keep in mind, we did nothing to create the dashboard or this graph. AppSignal automatically created this for us.
After running the test with the increased puma thread count, the response times are much more consistent, and the dashboard confirms that pool capacity stays within acceptable levels.
Now it is time to turn up the dial. The number of JMeter concurrent clients is increased to 50, with a ramp-up time of 5 seconds. This test shows a poor response time and a number of API errors. The Puma magic dashboard again shows the available puma threads reaching zero.
Looking at the API code, we find that the model is being loaded from the database each time. This is not very efficient, so we change the Sidekiq job to not only grab the new daily price, but also run the ML model and save the prediction in the database.
We deploy this change.
Better API Performance with Sidekiq's Magic Dashboard
Now let's check our Sidekiq magic dashboard. Unfortunately, there is a bug in the code, but at least we can identify and fix it quickly.
With the Sidekiq PriceUpdateJob now working, the API is modified so that it only needs to retrieve the predicted price from the database. This improves the API performance, but we still see some API errors and lengthy response times.
Back to the Puma Magic Dashboard
A glance at the dashboard highlights that we have not yet configured Puma to use additional workers. A Puma worker is an OS-level process that can run several threads. The total thread count is calculated as the number of workers multiplied by the maximum threads. First, we use 2 workers, but the available threads are still exhausted. So we'll increase the amount to 4 workers.
Our API performance is now very good. The average response time is 419ms, and there are no API errors.
The magic dashboard confirms that there is still available thread capacity.
AppSignal's magic dashboards give us instant insights into the capacity of the Puma web server. The Sidekiq and Active Worker dashboards provide similar insights into our application's asynchronous jobs.
What We've Learned from Magic Dashboards
During our Rails application performance testing, the Puma magic dashboard helped us easily identify that the number of threads was insufficient for our desired throughput level. It shows the thread pool capacity, number of workers over time, and the total number of threads.
While the Sidekiq job did not have any performance issues, the magic dashboard helped us quickly identify that there was an error after deployment, which we were able to fix and redeploy rapidly. All of these monitoring capabilities were set up for us automatically by AppSignal.
AppSignal's Dashboard Features for Ruby and Rails Apps
Dashboards in AppSignal have namespaces, such as "web" application or "background" jobs, so you can create numerous monitoring views of your application. The built-in summary dashboard shows an overview of your application's health, including throughput, response time, and the latest errors.
Note that, as with any dashboard, you can edit what graphs and metrics are shown, as well as change the layout and the configuration of selected graphs.
Anomaly detection is a powerful feature. It allows you to define thresholds that send notifications when a metric value goes over or below a given value, such as free memory or the error rate.
Wrapping Up: Monitor Your Ruby App Today with AppSignal
Observability and performance are critical to the success of our applications. However, we often wait until the last minute to deal with these topics.
AppSignal's magic dashboards provide extensive out-of-the-box metrics, dashboards, and insights that are set up automatically. This allows you to rapidly tune your application’s performance and reach a state of operational readiness.
Read more about AppSignal for Ruby.
Until next time, happy coding!






Top comments (0)