The previous post was about thread divergence at the SASS level. Before I move on to other optimization strategies, I think it makes sense to first review GPU Flight’s architecture. Understanding the overall structure will make the upcoming topics easier to follow, and it should also be helpful for anyone trying to run the full system locally or in the cloud.
In this post, I want to step back and show the bigger picture: what each component does, why I separated them this way, and what kind of deployment setup makes the most sense in production.
The Big Picture
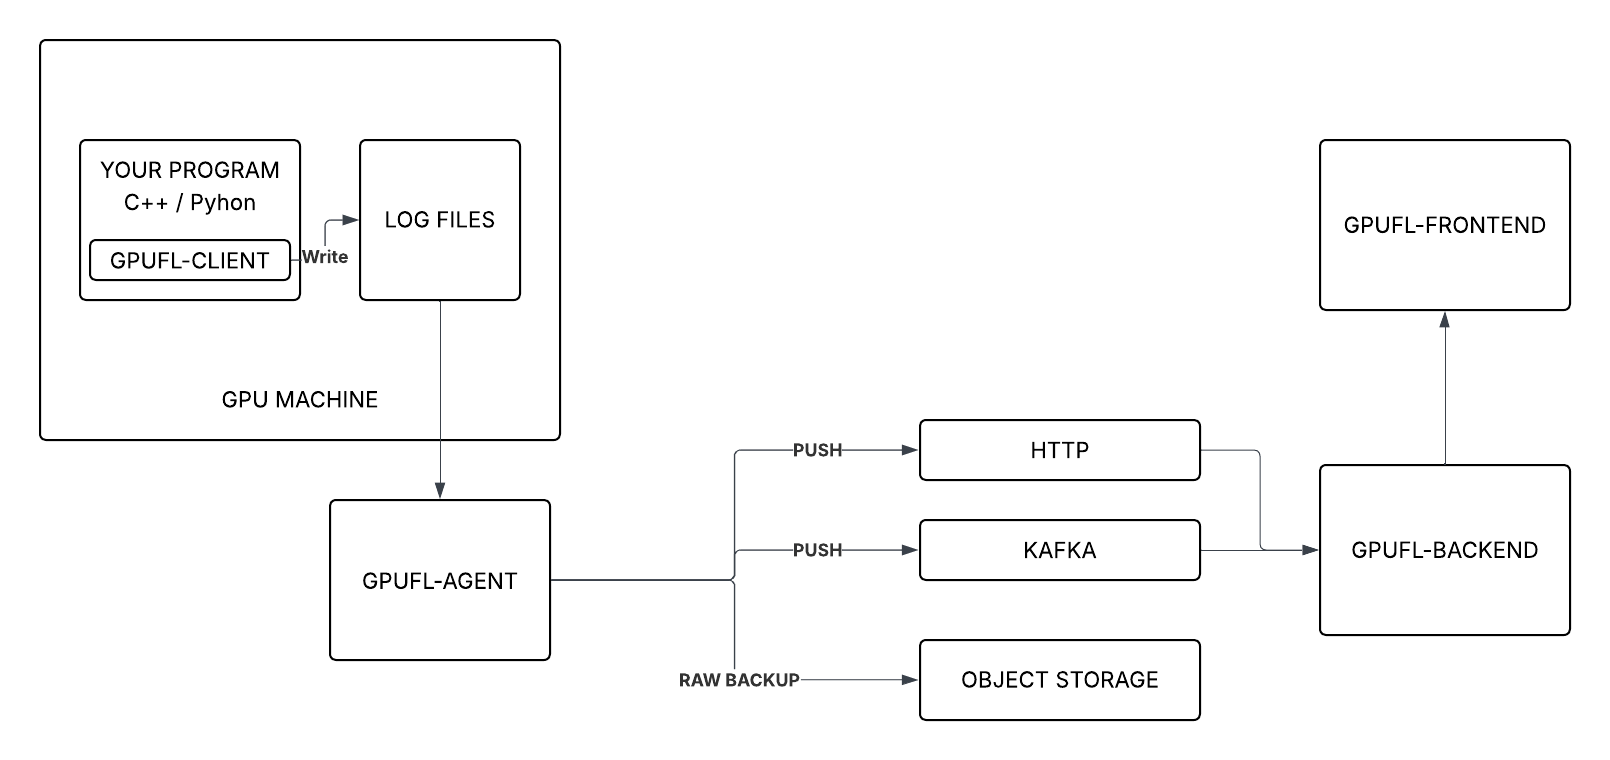
This is how all the components fit together:
In short:
- gpufl-client — runs on the GPU machine, hooks into CUDA activity, and writes structured logs
- gpufl-agent — watches those logs and sends them to the backend through HTTP or Kafka
- gpufl-backend — receives the events, stores them, and provides APIs for querying
- gpufl-front — React UI for browsing sessions and checking GPU behavior
gpufl-client — Capturing GPU Events
The client is a C++ library, or you can use the gpufl Python package. You link it into your application, call gpufl::init() when the program starts, and from there GPU Flight begins collecting GPU-related events automatically.
It can capture things like:
- Kernel launches — kernel name, grid/block dimensions, register count, shared memory, occupancy, timing
- Memory copies — copy direction, size, duration, throughput
- SASS metrics — warp-level per-instruction counters when the SassMetrics engine is enabled
- PC samples — warp stall reason distribution when the PcSampling engine is enabled
- System metrics — periodic NVML snapshots such as GPU utilization, VRAM usage, temperature, power draw, and fan speed
These are written into three JSONL log files:
<prefix>.device.log   ← kernel launches, memory copies, timing
<prefix>.scope.log    ← GFL_SCOPE blocks with optional SASS/PC data
<prefix>.system.log   ← periodic NVML snapshots
Log rotation is handled automatically. The agent tracks file offsets so events are never re-sent across rotations.
gpufl-agent — The Flexible Shipper
This part is important because it reflects one of the main design choices in GPU Flight.
The client just writes files. It does not know anything about HTTP, Kafka, or where the data is going. That responsibility belongs entirely to the agent.
The agent is a separate process that tails the log files and forwards the events to the backend. Because it is separated from the client, it can run anywhere as long as it can access the log folder.
┌──────────────────────────────┐
│         GPU Machine          │
│                              │
│  gpufl-client → .log files   │
│                    │         │
│             gpufl-agent      │   ← simplest: agent on the same machine
└────────────────────┼─────────┘
                     │  (or NFS / shared volume)
                     ▼
              gpufl-agent           ← or: agent on a separate machine
I wanted to keep profiling logic as isolated as possible. Once the client is mixed with transport logic, the instrumentation library becomes harder to maintain and harder to use in different environments. By splitting them, I can change how data is shipped without changing the application binary.
What the agent does:
- Tails all three log streams concurrently
- Tracks file positions via a cursor file — survives restarts without re-sending events
- Follows log rotation, picking up renamed files automatically
- Publishes events via HTTP or Kafka
- Optionally archives the compressed raw log files to S3-compatible object storage
That last part is also useful. The raw .log files are the full original event stream. Keeping them in object storage can help later if you want long-term retention, auditability, or reprocess old runs with updated analysis logic.
Configuration examples:
# HTTP — simplest, good for dev or small deployments
gpufl-agent --folder=/var/log/gpuflight \
            --type=http \
            --url=http://backend:8080/api/v1/events/

# Kafka — recommended for production
gpufl-agent --folder=/var/log/gpuflight \
            --type=kafka \
            --brokers=kafka:9092

# Kafka + S3 archival
gpufl-agent --folder=/var/log/gpuflight \
            --type=kafka --brokers=kafka:9092 \
            --archiver-endpoint=https://s3.amazonaws.com \
            --archiver-bucket=gpu-traces \
            --archiver-access-key=KEY \
            --archiver-secret-key=SECRET
Why a message queue in production?
When multiple GPU machines are sending data simultaneously, publishing directly to the backend via HTTP couples the producer rate to the backend's processing speed. If the backend is slow, restarting, or temporarily down, events back up or are lost.
A message queue decouples the two sides:
  GPU node 1 ──┐
  GPU node 2 ──┼── gpufl-agent ──► Kafka ──► gpufl-backend
  GPU node 3 ──┘
- Buffering — Kafka holds events if the backend restarts or lags behind
- Burst handling — GPU workloads produce spiky event rates; Kafka absorbs the peaks
- Multiple consumers — other services can read from the same topic independently: alerting, analytics, archival
For a single machine or a development setup, HTTP is simpler and perfectly adequate. The agent supports both modes with a single flag.
gpufl-backend — Ingestion and API
The backend is a Spring Boot REST service. It has two responsibilities: ingesting events and answering queries.
Ingestion happens via POST /api/v1/events/{eventType}, where eventType is device, scope, or system. In a Kafka deployment, a consumer bridge reads from the topic and calls the same endpoint internally.
The three event types:
-
device— kernel launches, memory copies, precise timing from CUPTI -
scope—GFL_SCOPEtiming blocks, optionally enriched with SASS metrics and PC samples -
system— periodic NVML snapshots (GPU util%, VRAM, temperature, power draw, fan speed)
Query API — sessions list, system metrics over time, kernel events per session, profile samples per scope. The frontend is built entirely on top of this API; there's no special internal interface.
Auth — Bearer tokens for direct HTTP ingestion from the agent; API keys for programmatic access from the frontend or external tooling.
Data retention — configurable cleanup policy so disk usage stays bounded. Old sessions are pruned automatically once they exceed the configured retention window.
gpufl-front — The Dashboard
The frontend is a React + TypeScript SPA with a dark theme, connected to the backend REST API.
The main view is a three-tab dashboard scoped to a single profiling session:
┌────────────────────────────────────────────────────┐
│  Session: my_training_run  [host: gpu-node-01]     │
├──────────────┬─────────────┬───────────────────────┤
│   Kernels    │   Scopes    │       System           │
└──────────────┴─────────────┴───────────────────────┘
Kernels tab — timeline of kernel launches. Click any kernel to open the Inspector: occupancy, register count, shared memory, grid and block dimensions, and the CPU call stack that triggered the launch.
Scopes tab — hierarchical tree of
GFL_SCOPEblocks with timing breakdown. For sessions using the SASS Metrics engine, each scope shows the divergence data from the previous post.System tab — time-series charts for GPU util%, VRAM usage, temperature, power draw, and fan speed across the full session duration.
The session selector lets you browse by host and application name, so you can compare runs across machines or across time.
What's Next
Next post is a local setup guide: a Docker Compose file that brings up the full stack — client example, agent, backend, and frontend — on a single machine. If you want to try GPU Flight without configuring anything manually, that post will cover it end-to-end.
Cloud demo coming soon. I'm currently working on a live deployment. Once it's up, I'll post a link so you can browse real GPU profiling data in the UI without setting up anything yourself.
GPU Flight is open source: github.com/gpu-flight

Top comments (0)