
Linear regression is very good and simple statistical method. However, sometimes data is spread too much and linear function is just not enough. Sometimes, we need some more complex function to make good prediction. This is where we could use polynomial regression.
Simple linear regression
Let’s start with reminder of what simple linear regression. It is statistical method where we are trying to fit straight line, and using function of it we are trying to predict value of new, unseen, value for variable x. This is a very basic explanation and more details you can find in my previous post on simple linear regression and multiple linear regression. However, I do hope in combination with chart bellow it gives enough information to easier understand polynomial regression.

Problem
Sometimes we can have more complex distribution of data. Some that we can’t aproximate with straight line. Let’s imagine cycling downhill. We start with some small speed, but with time we are driving faster and faster. If we measure our speed in 5 different moments, we could get chart like bellow.

Here we can see we could use simple linear regression to predict speed in some randomly chosen time. But we can also see that this is not very precise. In first moment, we are close to correct value. Then difference starts increasing, then reducing again. We could do better with different equation. Maybe quadratic one?
Polynomial regression
Now this is where we can use polynomial regression. Situations where we have more complex relationship between input variables and output than linear one.
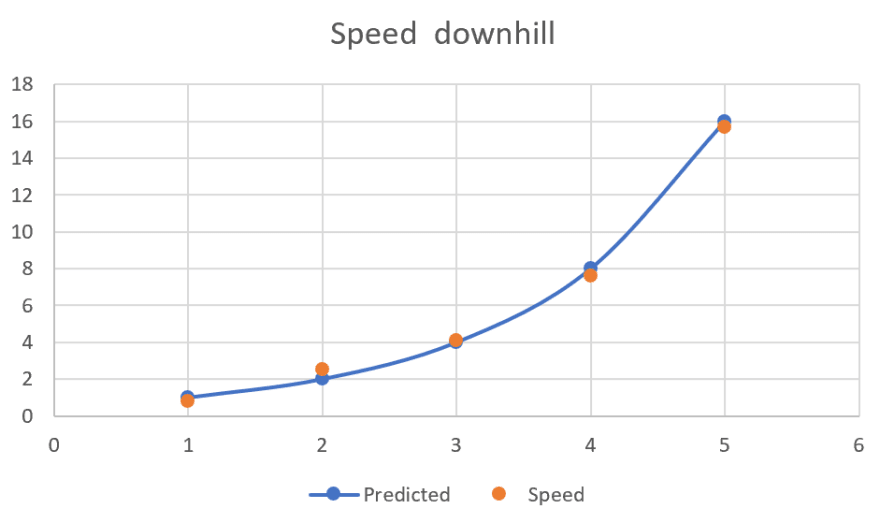
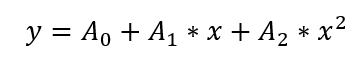
In the chart we can see more appropriate function chart that fits our data much better. More specific, this is chart of quadratic equation.
In conclusion, polynomial regression is statistical method where we use functions with higher exponent to form more complex forms.
More specific mathematical expression
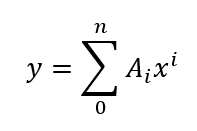
In previous example I used quadratic equation. But we could have any other degree of equation. Which is why we can use equation above as general term, and we chose coefficients A to best fit our model
Conclusion
Simple and multiple linear regressions are perfectly fine models but not fit for all use cases. When you want to use regression, it is good to visualize data to understand better what kind of function would fit it best. If it is more complex, polynomial one might be better choice.
In this post, I didn’t cover any coding examples or underlying theory because I believe it is worthy to understand idea of it before going into details. I will be covering those in other post. For now, any code examples I have, you can find in my Github repository that follows Udemy Machine learning A-Z course.

Oldest comments (0)