Profiling Python applications using Pyflame
This post originally appeared on Build Smarter.
Perhaps you’ve faced the fortunate challenge of scaling up a Python application to accommodate a steadily increasing user base. Though most cloud hosting providers make it easier than ever to throw more hardware at a problem, there comes a point when the cost outweighs convenience.
Around the time scaling horizontally starts looking less attractive, developers turn to performance tuning to make applications more efficient. In the Python community there are a number of tools to help in this arena; from the built-in timeit module to profiling tools like cProfile, there are quick ways to test the difference between a particular line of code and any of its alternatives.
Although profiling tools help you see important information about which calls in your application are time consuming, it’s difficult to exercise an application during local development the same way your users exercise it in real life. The solution to bridging this gap? Profile in production!
Pyflame
Pyflame is a profiling tool for Python applications that makes use of the ptrace(2) system call on Linux. ptrace allows processes to observe (and in some use cases, manipulate) another process’ memory. Pyflame ultimately uses ptrace to aggregate statistics about a running Python process’ stack in a format that’s helpful for visualizing where that process spends the majority of its time. Since Pyflame runs as a separate process and inspects existing stack data, its overhead is small compared to solutions that run as part of the process itself. This also means you can be sure the profile analysis you end up with faithfully represents your application’s behavior and isn’t greatly skewed by the profiling work.
After running Pyflame and a bit of post-processing you’ll be able to generate visualizations like this:
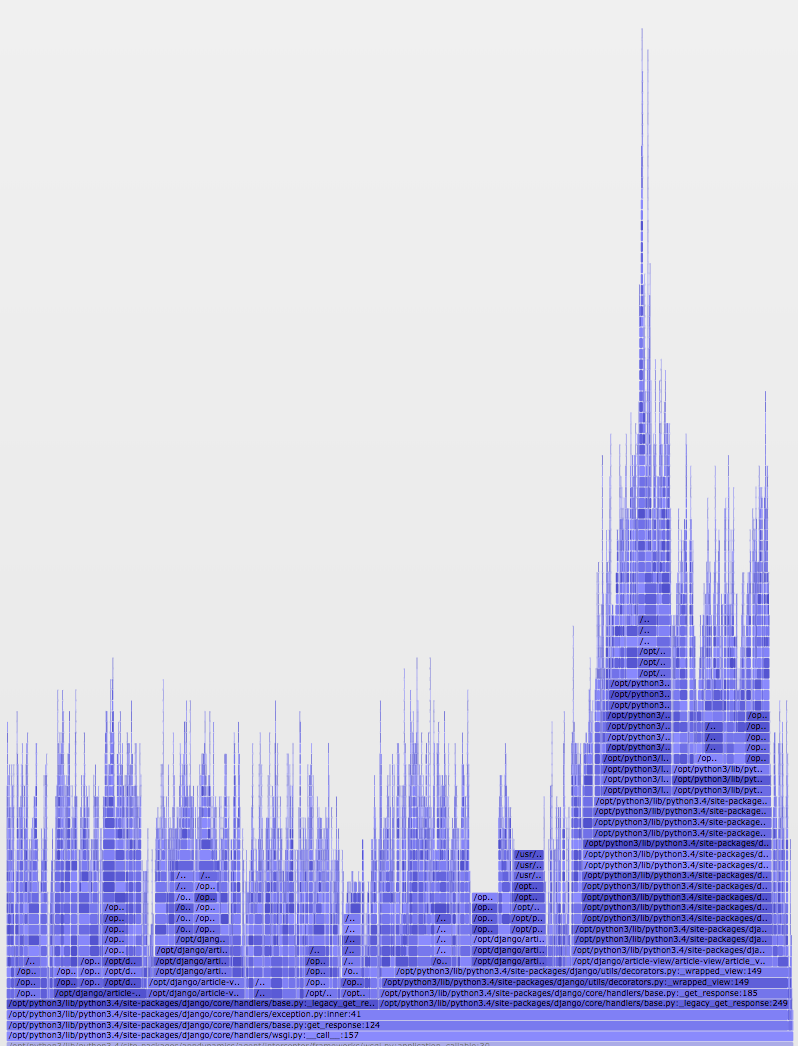
But how?
As ptrace is specific to Linux, Pyflame can only target applications running in a Linux environment. Pyflame may also need some help finding your Python; it defaults to trying to link against Python 2.7 if it isn’t sure what Python to use. Given these caveats, installation takes just a few steps that will produce a pyflame executable:
$ git clone [https://github.com/uber/pyflame](https://github.com/uber/pyflame)
$ cd pyflame/
$ ./autogen.sh
$ ./configure
$ make
The pyflame executable can be found in the src directory after the build.
Now that you’ve built the tool, it should be ready to analyze your Python application. To do so, start by snagging the process ID (PID) of the application you’re interested in. If you’re running a Django application, for instance, this would probably be the PID of one of the WSGI workers running the Django app. After you’ve got a PID handy, you’ll run pyflame with options for:
- How long to sample the process, in seconds
- How often to sample the stack of the process, in seconds
- Removing the idle time of the application from the data to simplify the resulting visualization
- The name of the output file
- The PID of the process
This will look something like
$ ./src/pyflame -s 300 -r 0.01 -x -o my-app-20181212.samp -p 9876
Pyflame will sample the process with PID 9876 every ten milliseconds for five minutes, producing the my-app-20181212.samp data file. Trying to read this file yourself won’t make a lot of sense, but fortunately it’s in just the right format for FlameGraph.
FlameGraph
FlameGraph is an interactive visualization tool for exploring CPU, memory, and other trace data. Since you’ve got your trace data, you can run it through FlameGraph in a couple of additional steps:
$ git clone [https://github.com/brendangregg/FlameGraph](https://github.com/brendangregg/FlameGraph)
$ cd FlameGraph/
$ cat /path/to/my-app-20181212.samp | ./flamegraph.pl > my-app.svg
Open up the my-app.svg file in a browser and you’ll see something resembling the screenshot from earlier. You can hover over any segment to see what call it is and how much of the CPU time it represents. Clicking on a segment zooms into it so that you only see it and its children. Most usefully, you can perform a regex-capable search using the “Search” button in the top right. Searching for a particular pattern will highlight any matches:
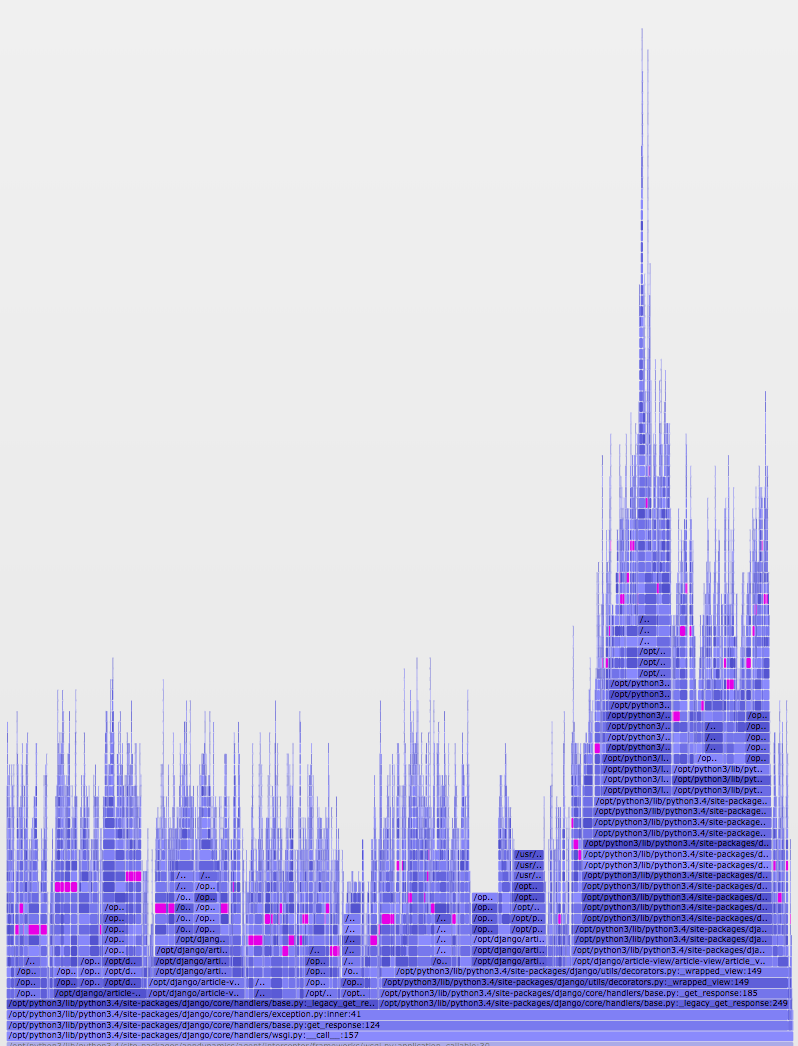
By exploring a flame graph, you can more easily find slow and common calls in your application that aren’t always obvious from poring over loads of raw text. And by identifying these calls, you can start to understand how you might effectively pare things down into a leaner application.
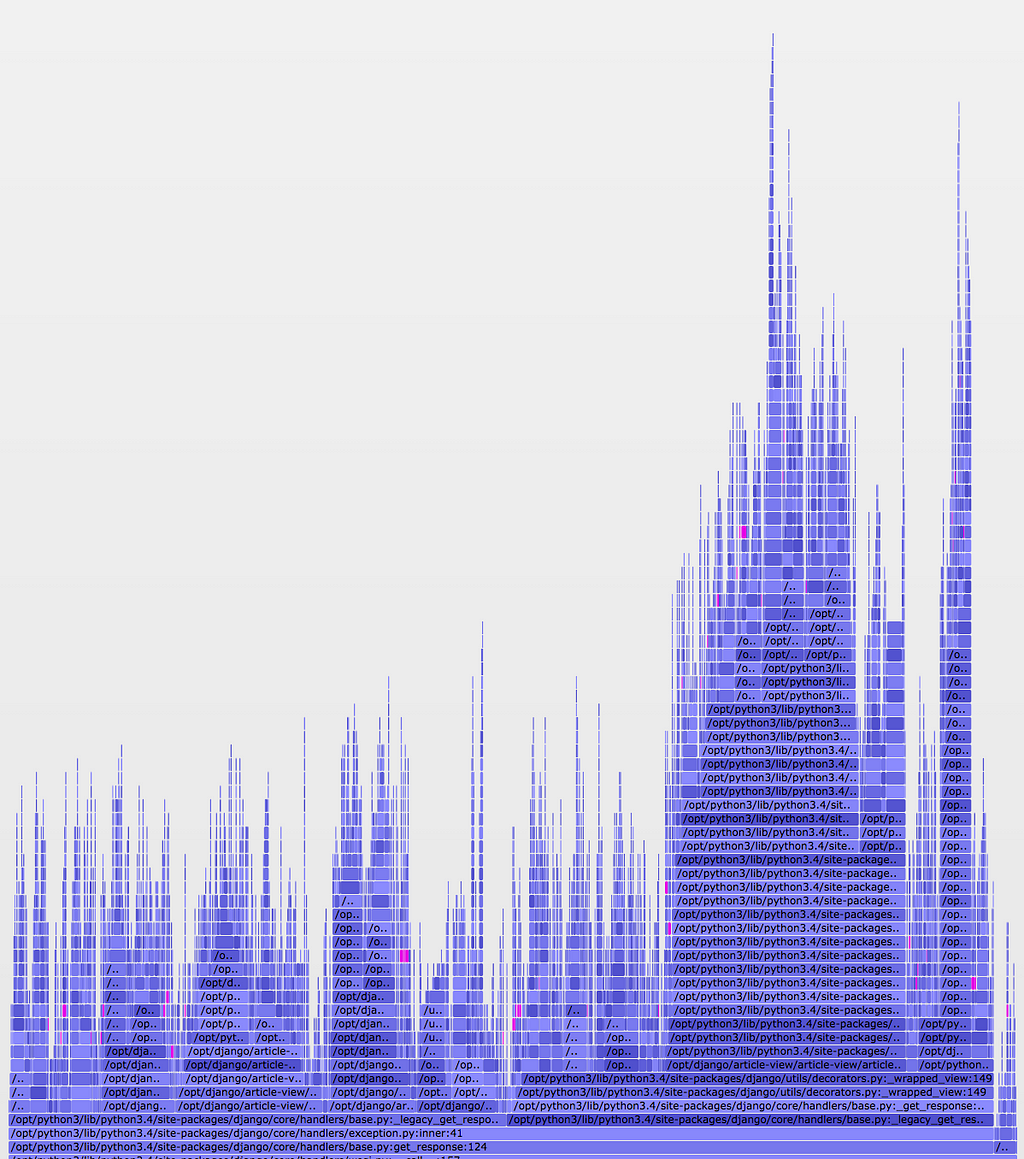
The pink segments above represent instances of a particular method call within our application; this call isn’t particularly expensive, but occurs many times on nearly every request. We realized that while we had code that seemed like it was caching these calls, the TTL was only set to one second. By updating the TTL to ten seconds, we were able to reduce how often this call occurred, which was confirmed in the “after” graph:
So what?
The call we were examining now consumes less of the total CPU time, but how does this translate to the real world? We’ve seen a noticeable drop in actual CPU load per request, shown by the increased gap between the two lines below:
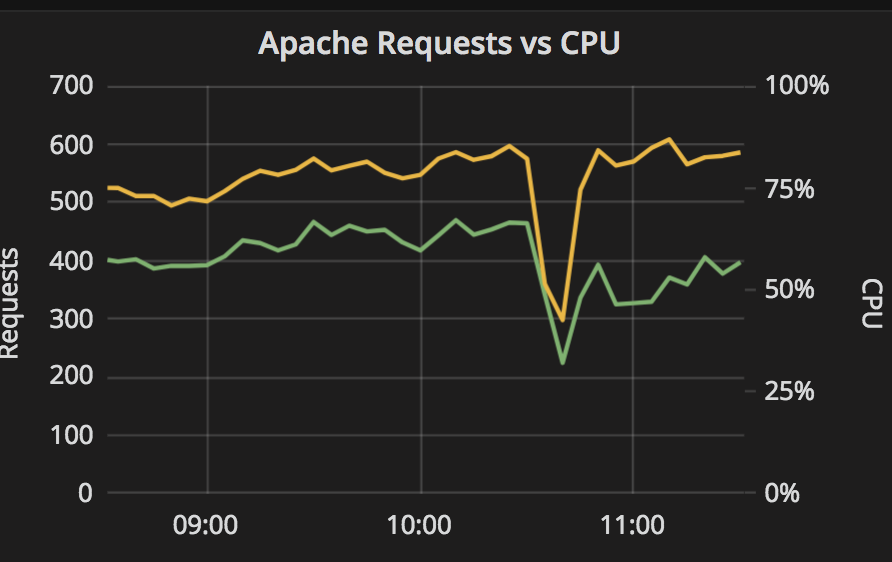
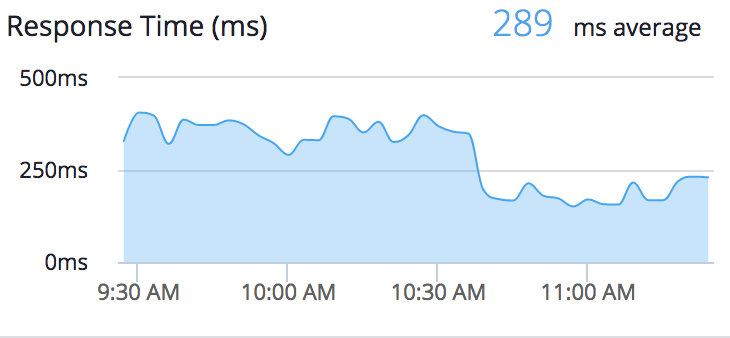
This drop in CPU load translated to increased throughput and a significant drop in response time:
Before this change, our application was largely CPU bound. We tune Apache to throttle connections in tandem with this behavior so that instances aren’t overwhelmed. After this change, there was enough headroom to reduce the application’s footprint by two server instances. We’re now connection bound and can look into opening that throttling up a bit, which could allow us to shed another instance or two. Across all our applications, especially those requiring significant computing resources, these kinds of optimizations can lead to thousands in savings annually.
Pyflame is not just helpful for identifying opportunities, but also helpful for confirming hypotheses. Optimizing calls that appear frequently/loudly in the flame graph can result in tangible benefits, which can ultimately reduce cost. I recommend adding this tool to your arsenal for performance testing and monitoring.
To see more about flame graphs, Pyflame, and profiling tools, check out these resources:
- “Visualizing Performance with Flame Graphs” by Brendan Gregg, USENIX ATC ’17
- rbspy, a sampling profiler for Ruby (by Julia Evans)
- “Build Impossible Programs” by Julia Evans, Deconstruct 2018
- “Flamegraph that! Self-service profiling tool for Node and Python services” by Ruth Grace Wong, PyCon Canada 2017

Oldest comments (0)