In the new release, we are introducing Custom Metrics, one of the most requested features. Additionally, we've made several improvements related to thresholds, memory consumption, CSV, HTML reports, and more.
Custom Metrics

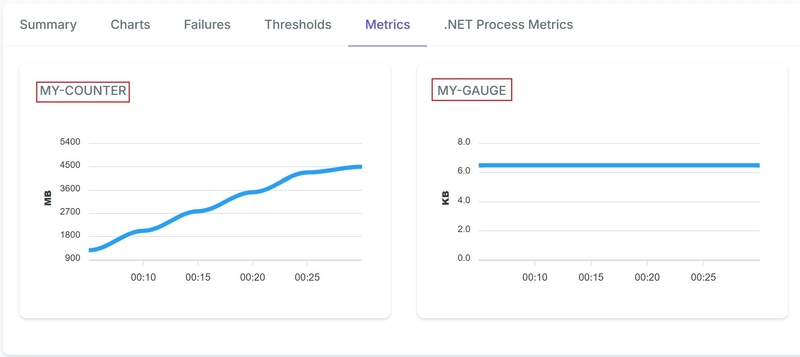
Metrics are numerical measurements reported over time. By default, NBomber automatically collects built-in metrics: CPU, RAM (usage), Data (sent/receive), and more. Besides built-ins, now you can define your custom metrics.
NBomber provides different types of custom metrics that you can use, depending on what you want to measure. These include:
- Counter: a cumulative count of events, such as the number of successful or failed requests.
var counter = Metric.CreateCounter("my-counter", unitOfMeasure: "MB");
counter.Add(2); // tracks a value that may increase or decrease over time
counter.Add(-1);
- Gauge: measures the last value recorded, such as memory usage or the number of active users at a given time.
var gauge = Metric.CreateGauge("my-gauge", unitOfMeasure: "KB");
gauge.Set(6.5);
gauge.Set(7.3); // set the current value of the metric
You can use your custom metrics with thresholds.
var scenario = Scenario.Create("scenario", async context =>
{
    ...
})
.WithThresholds(
    Threshold.Create(metric => metric.Counters.Get("my-counter").Value < 1000),
    Threshold.Create(metric => metric.Gauges.Get("my-gauge").Value >= 6.5)
);
Or define thresholds in the JSON config file:
"ThresholdSettings": [
    { "Metric": ["my-counter", "value < 1000"] },
    { "Metric": ["my-gauge", "value >= 6.5"] }
]
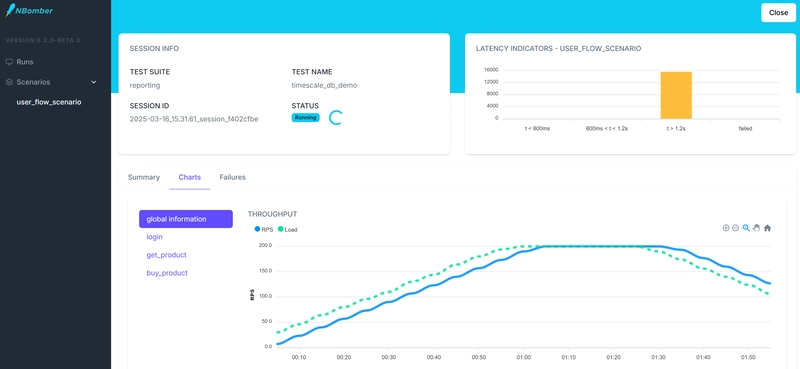
All these capabilities open up new ways to validate specific conditions. After running a load test, you will be able to view and check custom metric values in the HTML report.
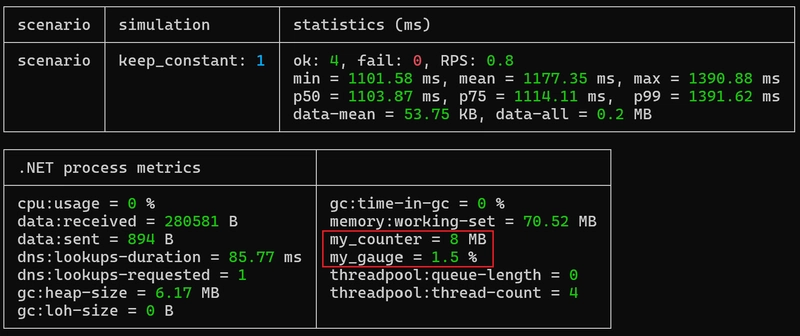
You can also see them in the Console UI.
For more information about this feature, please refer to our documentation.
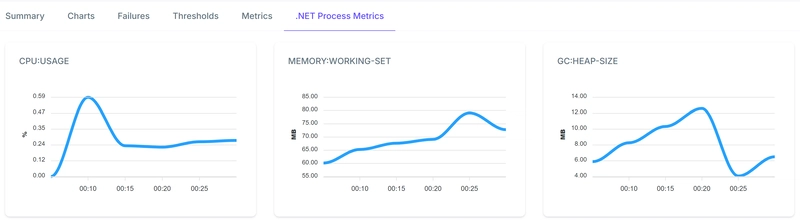
HTML Report: New Metrics Tabs
We've slightly rearranged the tabs in the HTML report to provide more convenient navigation based on the scenario context.
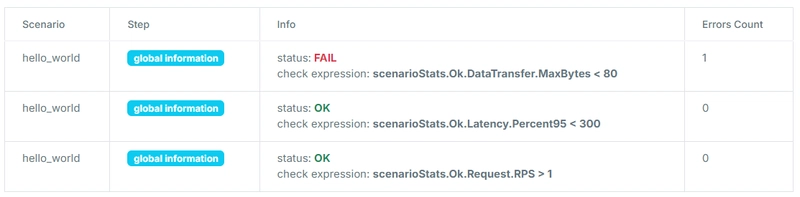
HTML Report: Printout Threshold code body
In the previous v5.8 release, NBomber introduced a new feature called Runtime Thresholds. This feature allows you to define thresholds using C#/F# code or JSON expressions. Defining thresholds in JSON was a bit more complete as you could see the JSON expression text in your HTML report. The downside of defining a threshold using C#/F# code was that checkExpression wasn't displayed in the final HTML report.
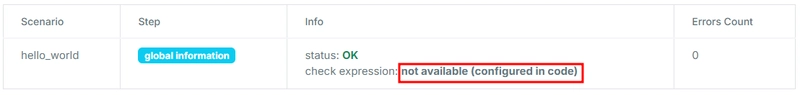
Well, we've fixed that! In the new release, we've added functionality that iterates over the code body and prints it.
GetScenarioTimerTime
We've added a feature that allows you to get the current time of the scenario timer. This can be useful for scenarios that depend on time-based criteria within the scenario.
var scenario = Scenario.Create("hello_world_scenario", async context =>
{
    var currentScenarioTime = context.GetScenarioTimerTime();

    context.Logger.Information($"Current scenario time: {currentScenarioTime}");

    return Response.Ok();
})
You can find the complete example by this link.
Custom Latency
We've added an option to pass custom latency, which can be useful for streaming-based scenarios where you need to measure the latency between several independent processes that publish and consume data independently. In the future, we will describe this use case in our documentation and provide guidance on how to handle it.
Response.Ok(customLatencyMs: 120)
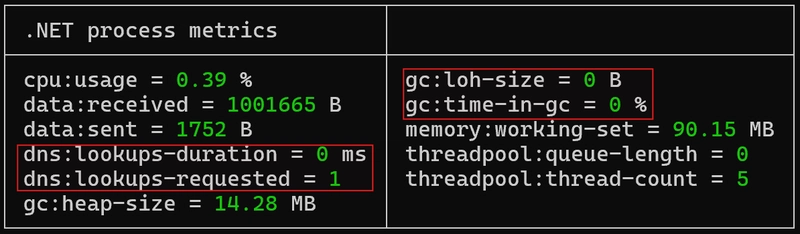
New System Metrics
We've expanded our standard list of system metrics by adding a few important ones:
-
dns-lookups-duration- The average time taken for a DNS lookup -
dns-lookups-requested- The number of DNS lookups requested since the process started -
gc:loh-size- The number of bytes for the large object heap -
gc:time-in-gc- The percent of time in GC since the last GC
CSV Report: Failures Stats
Previously, NBomber's CSV reports didn't include statistics on failures. The default way to get failure stats was by getting them from the final NodeStats record or by using IReportingSink and subscribing to real-time metrics. However, some of our clients still rely on CSV for extracting data to process further. To maintain consistency with other reports, we've now added failure statistics to the CSV report as well.
Logs folder change for NBomber Cluster
When running NBomber Cluster, the Coordinator folder and Agent(s) folders are created at the same level. This can be inconvenient if you're storing logs in blob storage. We've addressed this by nesting the Agent logs under the same session folder path. The folder structure now looks like this:
-
sessionId/reports- for Coordinator -
sessionId/reports/agentId- for Agent
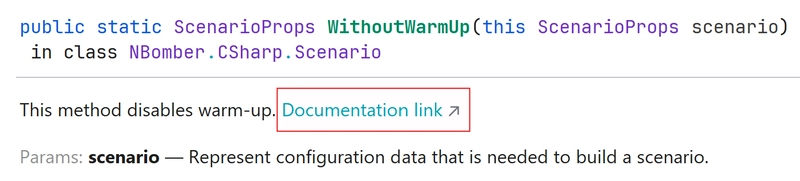
XML documentation link
Since day one, NBomber has provided documentation comments for IDE IntelliSense. While this works well, there were cases where a more detailed documentation page would be helpful. To address this, we've added a link to the Documentation page that describes specific features. Now, you can click the Documentation link in the pop-up window and navigate to the full page documentation.
Performance improvements
At NBomber, we are always striving to optimize performance, aiming to make our framework the fastest and most resource-efficient. This release is no exception.
Mean and StdDev
We made an optimization related to the calculation of Mean and StdDev. For real-time reporting, we need to calculate these values periodically (each 5 sec). Previously, we had to iterate through all items to calculate the Mean. However, we discovered that we can completely skip this step by tracking the Mean as we go. This optimization also contributed to the performance of StdDev, which depends on the Mean calculation.
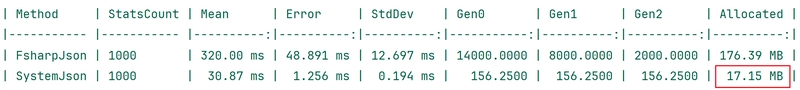
JSON serialization
We found that for long-running scenarios, especially those lasting over 1-2 hours, generating the HTML report can be quite heavy. The main contributor to this is extra memory allocations that occur when serializing the metrics history in JSON for the HTML report. Historically, we used the F# JSON serializer, which works well with F# types and also plays an important role in schema validation for JSON config parsing. F# JSON validates the JSON based on the types you pass, which is great. However, the downside is that this library was written a long time ago and isn't very memory-efficient. In the new release, we've limited the use of F# JSON, using it only for parsing the JSON config. For all other cases, we've switched to the standard .NET System.Text.Json, which delivers much better performance. In addtition, we conducted a benchmark using one hour of statistics for five concurrent scenarios.
Statistics compression
We've started compressing statistics, which has reduced memory usage. While we hadn't encountered any issues with this in the past, we still decided to optimize it.
Previously, storing one hour of stats for a single scenario required ~5MB of RAM. With the new optimizations, we've reduced it to just 360KB. In absolute numbers, the impact is minimal, but optimizations like this help reduce GC pressure, making them worthwhile.
NBomber Studio
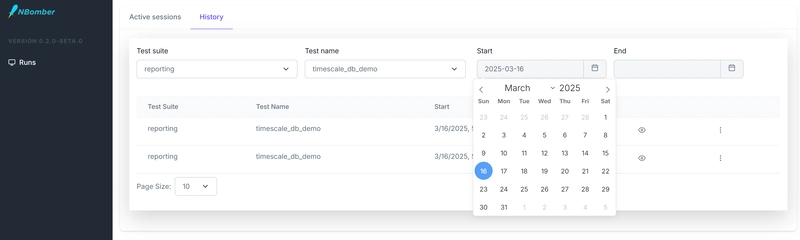
Alongside NBomber, we released a new version of NBomber Studio. This update includes bug fixes related to frontend session handling and improvements to the UI. We've removed manual steps, such as having to click the refresh or search button to get updates.
In the previous version, UI auto-updates only worked for an open session, but we've now expanded this functionality further. The search button has been removed from filtering, and now, when you change something—such as the date range or test name—requests are sent automatically. Additionally, we’ve added auto-updating for the History tab, as it's a useful feature.
What is next
- Original blog post
- Release Notes for v6.0.1
- Please follow our Roadmap page for the upcoming release.

Top comments (0)