Newbie to Machine Learning?
Need a nice initial project to get going?
You are on the right article!
In this article, we will try to build a very basic stock prediction application using Machine Learning and its concepts. And as the name suggests it is gonna be useful and fun for sure. So let's get started.
We expect you to have a basic exposure to Data Science and Machine Learning.
"The field of study that gives computers the ability to learn without being explicitly programmed"
is what Arthur Samuel described as Machine Learning.
Machine Learning has found its applications in various fields in recent years, some of which include Virtual Personal Assistants, Online Customer Support, Product Recommendations, etc.
We will use libraries like numpy, pandas, matplotlib, scikit-learn, and a few others.
If you are not familiar with these libraries, you can refer to the following resources:
Steps in Machine Learning
While performing any Machine Learning Task, we generally follow the following steps:
Collecting the data
This is the most obvious step. If we want to work on an ML Project we first need data. Be it the raw data from excel, access, text files, or data in the form of images, video, etc., this step forms the foundation of future learning.Preparing the data
Bad data always leads to bad insights that lead to problems. Our prediction results depend on the quality of the data used. One needs to spend time determining the quality of data and then taking steps for fixing issues such as missing data etc.Training the model
This step involves choosing the appropriate algorithm and representation of data in the form of the model. In layman terms, model representation is a process to represent our real-life problem statement into a mathematical model for the computer to understand. The cleaned data is split into three parts – Training, Validation, and Testing - proportionately depending on the scenario. The training part is then given to the model to learn the relationship/function.Evaluating the model
Quite often, we don’t train just one model but many. So, to compare the performance of the different models, we evaluate all these models on the validation data. As it has not been seen by any of the models, validation data helps us evaluate the real-world performance of models.Improving the Performance
Often, the performance of the model is not satisfactory at first and hence we need to revisit earlier choices we made in deciding data representations and model parameters. We may choose to use different variables (features) or even collect some more data. We might need to change the whole architecture to get better performance in the worst case.Reporting the Performance
Once we are satisfied by the performance of the model on the validation set, we evaluate our chosen model on the testing data set and this provides us with a fair idea of the performance of our model on real-world data that it has not seen before.
Now coming to our project, as we are dealing with the stock market and trying to predict stock prices the most important thing is being able to Read Stocks
How to Read Stocks?
Reading stock charts, or stock quotes is a crucial skill in being able to understand how a stock is performing, what is happening in the broader market, and how that stock is projected to perform.
Stocks have quote pages or charts, which give both basic and more detailed information about the stock, its performance, and the company on the whole. So, the next question that comes up is what makes up a stock chart?
Stock Charts
A Stock Chart is a set of information on a particular company's stock that generally shows information about price changes, current trading price, historical highs and lows, dividends, trading volume, and other company financial information.
Also we would like to familiarise you some basic terminologies of the stock market
Ticker Symbol
The ticker symbol is the symbol that is used on the stock exchange to delineate a given stock. For example, Apple's ticker is (AAPL) while Snapchat's ticker is (SNAP).
Open Price
The open price is simply the price at which the stock opened on any given day
Close Price
The close price is perhaps more significant than the open price for most stocks. The close is the price at which the stock stopped trading during normal trading hours (after-hours trading can impact the stock price as well). If a stock closes above the previous close, it is considered an upward movement for the stock. Vice versa, if a stock's close price is below the previous day's close, the stock is showing a downward movement.
Now its time to get your hands dirty and begin setting up the project
Initializing our project
Step 1 : Collecting the data
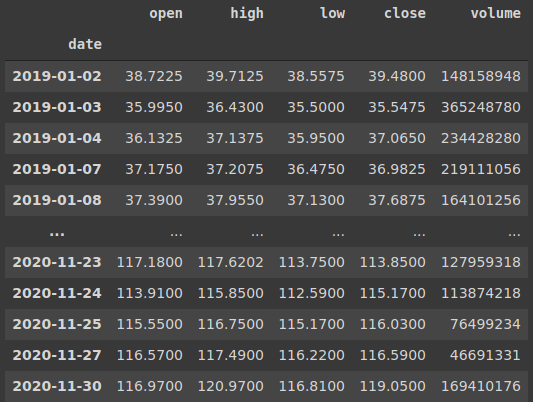
Use the iexfinance library to download the dataframe. The dataframe which we get contains daily data about the stock. The downloaded dataframe gives us a lot of information including Opening Price, Closing Price, Volume, etc. But we are interested in the opening prices with their corresponding dates.
import pandas as pd
import numpy as np
import iexfinance
from iexfinance.stocks import get_historical_data
from datetime import datetime, date

# start date should be within 5 years of current date according to iex API we have used
# The more data we have, the better results we get!

start = datetime(2016, 1, 1)
end = date.today()
# use your token in place of token which you will get after signing up on IEX cloud
# Head over to https://iexcloud.io/ and sign-up to get your API token
df = get_historical_data("AAPL", start=start, end=end, output_format="pandas", token="your_token")
Step 2 : Preparing the data
Also, it would convenient to convert the dates to their corresponding time-stamps. And finally, we will be having a dataframe which will contain our opening prices and time-stamps.
We need to know that the model we created is good. We are going to hold back some data that the algorithms will not get to see and we will use this data to get a second and independent idea of how accurate the best model might actually be.
We will split the loaded dataset into two, 80% of which we will use to train, evaluate, and select among our models, and 20% that we will hold back as a validation dataset.
from sklearn.model_selection import train_test_split

prices = df[df.columns[0:1]]
prices.reset_index(level=0, inplace=True)
prices["timestamp"] = pd.to_datetime(prices.date).astype(int) // (10**9)
prices = prices.drop(['date'], axis=1)
prices

dataset = prices.values
X = dataset[:,1].reshape(-1,1)
Y = dataset[:,0:1]

validation_size = 0.15
seed = 7

X_train, X_validation, Y_train, Y_validation = train_test_split(X, Y, test_size=validation_size, random_state=seed)
The function train_test_split() comes from the scikit-learn library.
scikit-learn (also known as sklearn) is a free software machine learning library for Python. Scikit-learn provides a range of supervised and unsupervised learning algorithms via a consistent interface in Python.
The library is focused on modeling data. It is not focused on loading, manipulating, and summarizing data.
Step 3 : Training the model
We don’t know which algorithms would be good on this project or what configurations to use.
And So, we are testing with 6 different algorithms:
- Linear Regression (LR)
- Lasso (LASSO)
- Elastic Net (EN)
- KNN (K-Nearest Neighbors)
- CART (Classification and Regression Trees)
- SVR (Support Vector Regression)
from sklearn.linear_model import LinearRegression
from sklearn.linear_model import Lasso
from sklearn.linear_model import ElasticNet
from sklearn.tree import DecisionTreeRegressor
from sklearn.neighbors import KNeighborsRegressor
from sklearn.svm import SVR

# Test options and evaluation metric
num_folds = 10
seed = 7
scoring = "r2"

# Spot-Check Algorithms
models = []
models.append((' LR ', LinearRegression()))
models.append((' LASSO ', Lasso()))
models.append((' EN ', ElasticNet()))
models.append((' KNN ', KNeighborsRegressor()))
models.append((' CART ', DecisionTreeRegressor()))
models.append((' SVR ', SVR()))
Step 4 : Evaluating the model
from sklearn.model_selection import KFold
from sklearn.model_selection import cross_val_score

# evaluate each model in turn
results = []
names = []
for name, model in models:
    kfold = KFold(n_splits=num_folds, random_state=seed, shuffle=True)
    cv_results = cross_val_score(model, X_train, Y_train, cv=kfold, scoring=scoring)
    # print(cv_results)
    results.append(cv_results)
    names.append(name)
    msg = "%s: %f (%f)" % (name, cv_results.mean(), cv_results.std())
    print(msg)
The output of the above code gives us the accuracy estimations for each of our algorithms. We need to compare the models to each other and select the most accurate.
Once we choose which results in the best accuracy, all we have to do is to
- Define the model
- Fit data into our model
- Make predictions
Plot your predictions along with the actual data and the two plots will nearly overlap.
Step 5 : Reporting the model and making prediction
# Future prediction, add dates here for which you want to predict
dates = ["2020-12-23", "2020-12-24", "2020-12-25", "2020-12-26", "2020-12-27",]
#convert to time stamp
for dt in dates:
  datetime_object = datetime.strptime(dt, "%Y-%m-%d")
  timestamp = datetime.timestamp(datetime_object)
  # to array X
  np.append(X, int(timestamp))

from matplotlib import pyplot as plt
from sklearn.metrics import mean_squared_error

# Define model
model = DecisionTreeRegressor()
# Fit to model
model.fit(X_train, Y_train)
# predict
predictions = model.predict(Xp)
print(mean_squared_error(Y, predictions))

# %matplotlib inline
fig= plt.figure(figsize=(24,12))
plt.plot(X,Y)
plt.plot(X,predictions)
plt.show()
Hurrah! You finally built a Stock Predictor. We hope this article was of great help to beginners and everyone else alike. For those who are interested in taking this project to the next level, we recommend you to read on LSTMs neural nets and try implementing it.
Though we are predicting the prices, this model is practically not viable because a lot of other factors have to be considered while making predictions!
Model References
Update: We have made a new post following this article in which we have used Ensemble Methods to further enhance our models.


Stonksmaster: Predict Stock prices using Python and ML - Part II
Rishav Raj Kumar for GNU/Linux Users' Group, NIT Durgapur ・ Dec 10 '20 ・ 7 min read
We hope you found this insightful.
This was one of the projects in 10 Days of Code organized by GNU/Linux Users' Group, NIT Durgapur
Do visit our website to know more about us and also follow us on :
This article has been co-authored by


Latest comments (6)
Thanks for the article. Have been trying to follow the code and reproduce it, get some errors here and there. For example where you predict the future values at predictions = model.predict(Xp) you use Xp that is nowhere defined. For a beginner tough to figure out...
This approach is technically interesting but one should not try to sell snake oil here. You can't predict the future and all foreseeable developments are already contained in the stock market. What's making prices change is the element of surprise.
In the context of the equity market, this is true. Furthermore, the approach in this post is mathematically unsound as stock prices are serially correlated!
How strong would you indicate the results? Did you actually had success with this approach? I am asking because I read several times, that there is no evidence for beating the market over longer periods (years) using technical analysis.
From the ML perspective it would therefore be interesting which other data could be added to train the models that allows a much more detailed prediction?
Will surely try it.
Nice Article thanks
I'm getting back into the stock market and keen to start learning ML/Python so this ticks two boxes, thanks for the write up :)