
Background
I use Facebook Messenger as the primary point of communication with friends, and I always wanted to know who do I talk to most, when do I talk the most, what factors affect how/who I message. I also wanted to see a comparison between 2020 and the previous year. At work, we have started to use power BI as a good dashboard for various teams and clients to provide good analytics. I wanted to learn more about it, so this was a perfect opportunity to play around with it.
High Level Design
In terms of design, there is not much to it. There are no good APIs or easy 'real time' interfaces for personal messenger data which Facebook exposes. There are a few for chatbots and businesses, but they won't really do us any good.
Thanks to recent privacy laws, companies need to have the ability to provide users with what data they have on us. We can use this ability to download all the data and then import into Power BI and then play around with what is in it.
Facebook has it here: https://www.facebook.com/dyi
Solution
For most problems, I will try and break it into smaller steps. Now for this one, since I don't know what data FB has on messenger, I don't have a clear end picture in mind. I would want to see how many messages I have done per chat over a time period, but other than that, I will need to see what data they have and then see what I can do with it.
That said, there are still a few key steps, which I will need to do before hand
- Getting the data
- Importing the data into Power BI
- Generating Data Insights
Step 1 - Getting the data
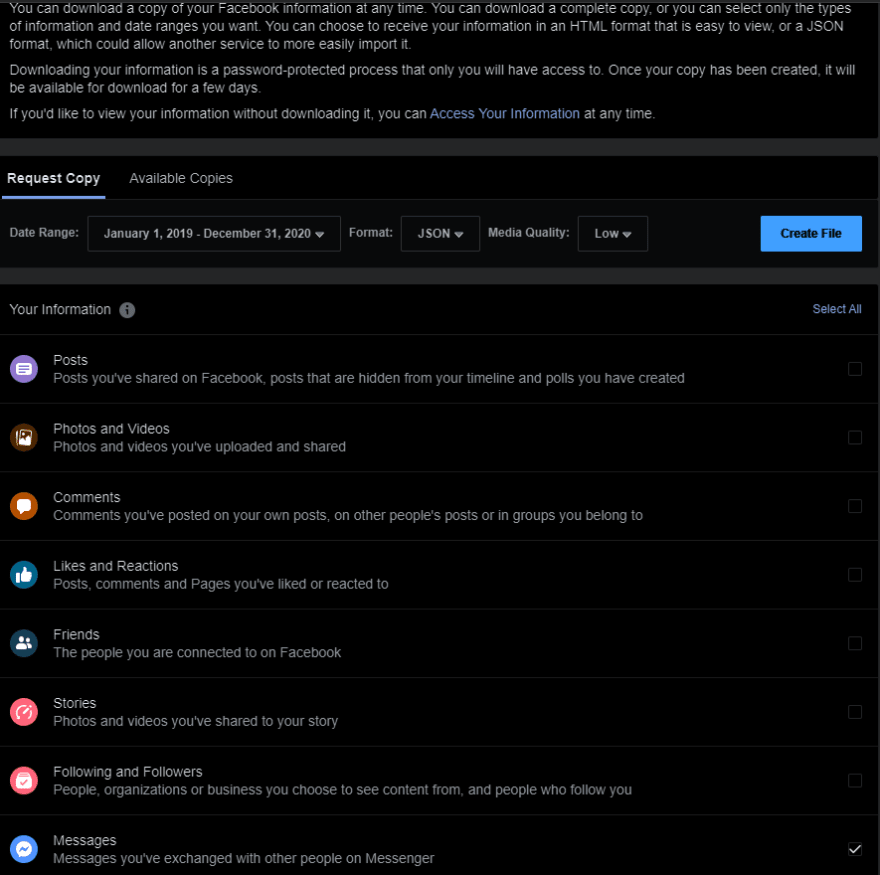
The data can be downloaded from https://www.facebook.com/dyi. Once I go there, I can see that there are quite a few different 'categories' of data which FB has. The one I need for this particular one is Messages. So I deselect all and just select that one.
For the Date Range, I will select only last 2 years. (When I first started, I only did a few weeks so I can get a small sample to give a good idea of the structure and then import the bigger date range later and just tell power BI to use the bigger date range, keeping all configurations the same. However for the sake of this post, I will go straight to 2 years to avoid repetition).
The format would be JSON. That is a lot more flexible than HTML and is a common data format that can be used by most applications. I don't care too much about the media (photos and videos) so I will keep it low. I don't want a high file size. Then I will create file.
FB then notified be after 30 min that the data was ready to be downloaded. It was around 2GB of data and downloaded as a zip file.
We have now gotten the data in some format.
Step 2 - Importing the data into Power BI
We have now downloaded the data, we need to put it in a format that Power BI likes. Luckily Power BI can import it in a lot of formats. Since we know the data is coming in JSON, to make life easier, we will continue to use JSON.
Looking into the zip folder (we haven't unzipped it yet), we can see the following folder structure:
messages/
  archived_threads/
  filtered_threads/
  stickers_used/
  inbox/
    chat1/
      message_1.json
      message_2.json
      .
      .
      .
      audio/
      files/
      gifs/
      photos/
      vidoes/
    chat2/
      .
      .
      .
What we want is the messages_*.json to just get the chat details. For the other ones such as the photos, videos, gifs etc, we don't really care about and that would just increase the file size.
My computer doesn't have that high specs (probably not so good for a dev, dont hate me :P) but it does give me more of an incentive to try and optimize how I can run things faster. Since I just need the low size json files, hopefully I can just unzip those and not the large size media files such as photos and videos. (That would be quite useful for a trip down memory lane, but for now, do not need them). This is where the power of linux can come really handy. We can use a wildcard template to unzip certain types of files. So by running this command in your unix terminal:
unzip "{location of where your facebook data is}" messages/inbox/*/*.json -d ./{folder where you want to unzip to}
Quickly unzip just the json into your desired folder and you got all the json files in 1 simple folder. Folder view of one chat message shown below.
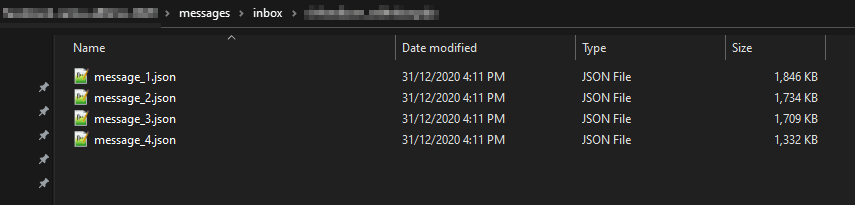
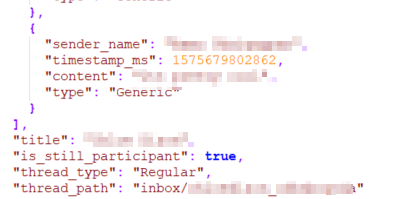
Looking into the JSON, it has the chat name, participants, timestamp of each message, whether it was a generic one, photo or video, title of the chat, type of chat. So quite a lot of details. Each JSON is also the same format which makes it much easier to manipulate.

Now we want to import all that JSON file into PowerBI. Unfortunately, I can't find a way to import multiple given a folder. I have found two alternative options
- Give a list of file locations, then give the list as the data source to import all JSON
- Combine all JSONs into 1 master JSON and then import that.
I went with the second option. Both needed a script to generate it as I wasn't going to do it manually. Having 1 master file seemed easier to work with at that time. (However now that I think about it, having a list would probably be more future proof as you can easily add on new files more easily rather than generating a master JSON all over again, maybe thats a topic for another time if I decide to expand on this project)
To create the master file, I would use a simple python script. Essentially, it just needs to scan every folder and their sub folders, find the json files and ten join each JSON together. Its all in the same format, so should be perfect.
import os
import json


def combine_json():
    master_json = []
    thisdir = os.getcwd()
    for r, d, f in os.walk(thisdir):
        for file in f:
            if file.endswith(".json"):
                with open(os.path.join(r, file)) as f:
                    data = json.load(f)
                    master_json.append(data)

    with open('master_json.json', 'w') as f:
        json.dump(master_json, f)


if __name__ == '__main__':
    combine_json()
Running that python script in the root inbox folder, will generate a master_json.json file with all the data.
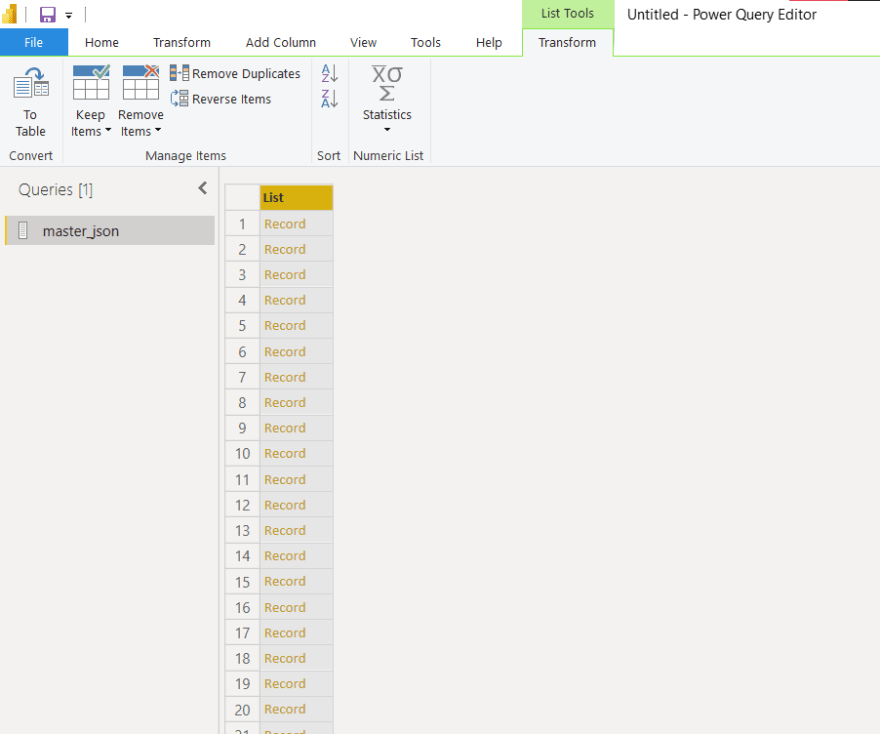
Now we can go to powerBI and import the JSON File, by Get Data > JSON > Add the master_json File. We will see a list of records. Each record is a JSON object from the JSON Array we just created
 .
.
We will click on To Table button on the top left and continue with default. PowerBI prefers table structure over anything else, so we need to make powerBI convert the JSON into an easy table structure.
Now that is it is a table, we want to expand all the different arrays in each object to get a nice flat file. Make sure that you load More before clicking Okay to get all the columns. Not all objects have the same properties (for example some may not have video and it won't be shown, by clicking load more, it will ensure that all properties/columns will be created). I also renamed the column when I saw fit.

Keep expanding/Expand to new rows for all the columns like above until there are no more columns to be created.
Once everything is expanded, to reduce some strain on power BI, i Removed a few columns such as videos and images URL etc.
Everything looks quite good, got each data in its own column, plenty of fields I wasnt even expecting such as reactions, and whether it was a shared link or not. One issue I could see straight away is the timestamp is in EPOCH time and not a normal date format. This is going to confuse powerBI when we want to do something with dates. We need to convert that to a date format.
Unfortunately, there is no default function to convert epoch to a date format, however it isnt too hard to do. We just need to create a new column whose formula is to add that many milliseconds to 01/01/1970, make the column a datetime field and rename it as timestamp.
#datetime(1970, 1, 1, 0, 0, 0) + #duration(0,0,0,([Messages.messages.timestamp_ms]/1000))
Now we have pretty much got all the data and can just close and apply. PowerBI will try and then load all the data in its efficient manner.
Step 3 - Generating Data Insights
Now that all the data is loaded, we can see quite a few fields such as sender, message title, time, what type of message etc we can use. We just need to try and get some nice insights out of it. The possibilities are endless. Here are a few I gotten:
Getting total number of Messages per Chat
First Thing I wanted to See was who I talked to the most and how many. I decided to use a bar chart and order it by most, this will give a list vertical rather than horizontal which is nicer to read.
I set Axis as Messages.title and Value as the count of message content.
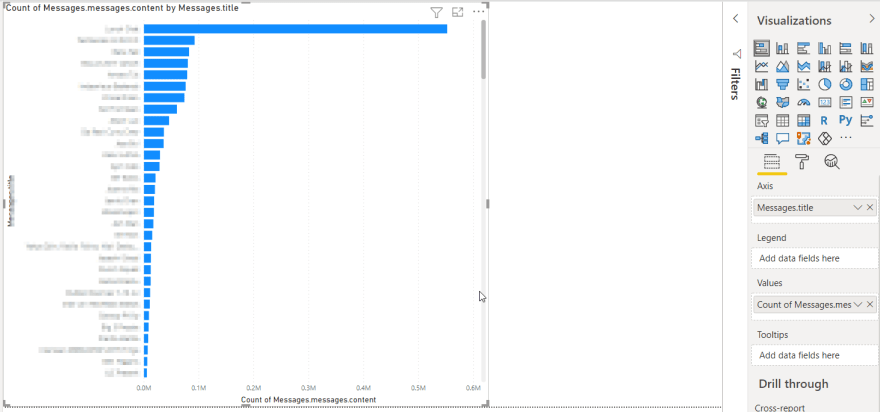
Immediately, I thought something was weird as there was no way we have done 0.6M messages for one chat, that seems way too much. I also noticed the top were group chats. Going into the data tab (left hand side table icon) and filtering by group. I could see that there were many rows 'duplicated' as there were so many participants in the chat, so each message is duplicated for each participant.
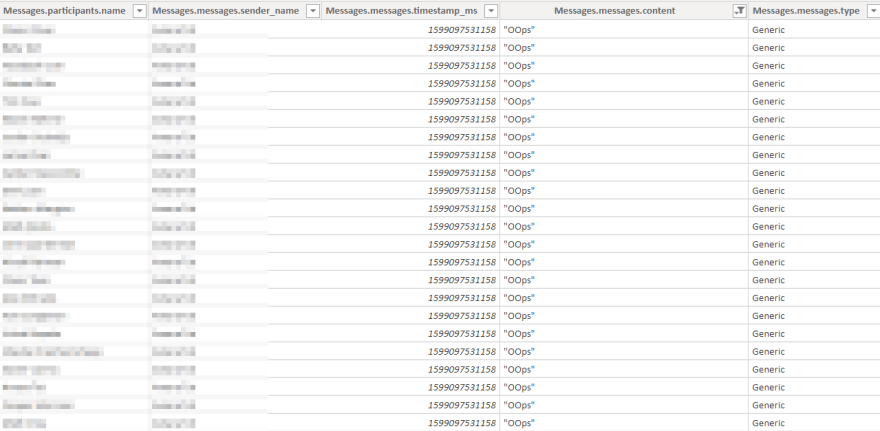
Hence we needed a proper measure to count the unique messages in a chat, rather than duplicate each time. Essentially, I wanted to get the distinct amount of messages in the selected part by using the content, timestamp and message title as the main key. This can be done through the DAX formula:
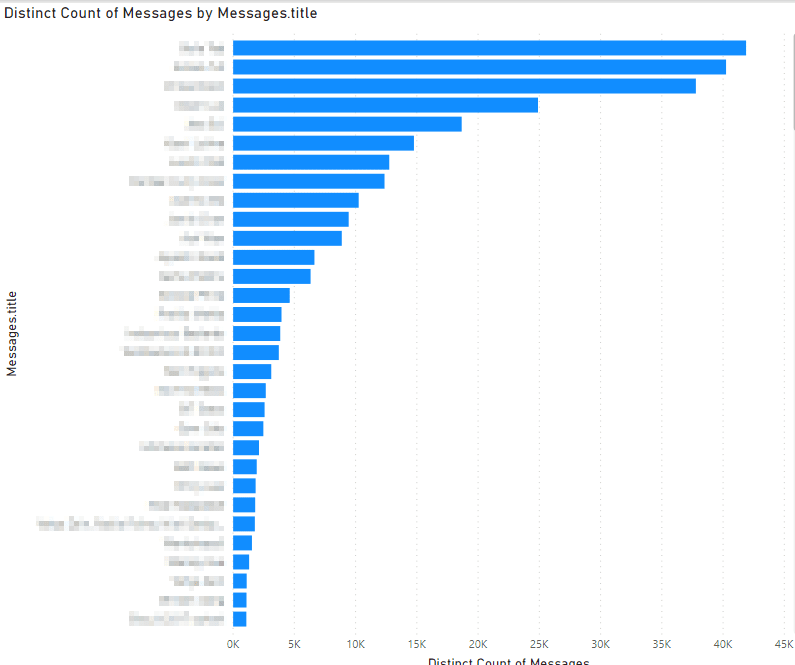
Distinct Count of Messages = COUNTROWS(GROUPBY(master_json,master_json[Messages.messages.content],master_json[Messages.title],master_json[Messages.messages.timestamp_ms]))
Now I am getting the correct number of messages. I have also confirmed the number of messages using react developer tools as found here. Yay!
Getting total number of Messages per Chat over Time
Now that I can get the correct amount of messages, I wanted to see how it was over time and see how I talked to someone.
So I created a line graph, where the timestamp is the Axis, Distinct count of messages is the count.
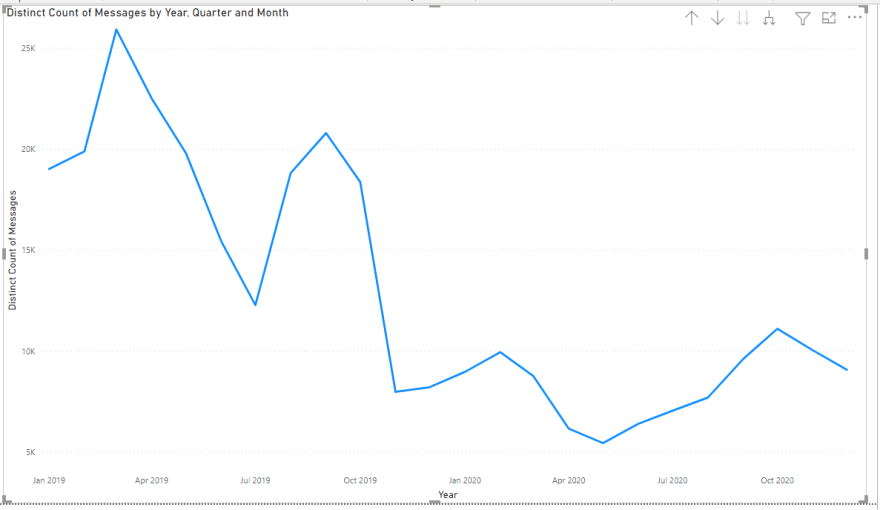
You can see that once covid hit, messages started to decline by quite a bit, which was quite intereting. Also with power BI, it is quite interactive so you can see how it is a certain point or go up the hierarchy etc.
I put the legend as the chat title, to see how each message title was. This was quite a lot of lines since there were quite a lot of titles, so I filtered that visualisation by the top 10 distinct count of messages to get it nicer.
However there was a problem, for chats who didnt have any messages on a particular date, the date didnt show as that record didnt exist. For example if the chat did not have any messages in March 2020, The graph would go from Feb 2020 to April 2020. To fix this, we need to create another measure to just add 0 to each count to force a value (even if that value is 0).
Full Count Of Messages = [Distinct Count of Messages] + 0
That seemed to fix it!
Creating the Year in Review Dashboard
After playing around with the data, I wanted to see my year in review. The main items I wanted to see (Some were just to fill the space to make it less ugly):
- Total Number of Messages in that year
- Comparison with total number of messages in previous year
- How many chats I was a part of
- How many calls I did
- How many shared links I did
- Trend of the messages over time
- Who I talked to most
- Which day had the most messages in 1 chat
Most of the stuff is just going to the specific visualisation and then putting the correct measure/column in and then filtering it as necessary.
To get the comparison with previous year, I needed to create another measure. This is essentially filtering the master json table with that specific year.
MessagesIn2019 = CALCULATE([Distinct Count of Messages],Filter(master_json, master_json[Time Stamp].[Year] = 2019))
Do the same for 2020 and then to get the percent comparison, you can use a simple fraction of the 2020 and 2019 messages and then - 1 to get a negative to show a decline.
Percentage Change = CALCULATE([MessagesIn2020]/[MessagesIn2019] - 1)
Putting everything together, I have gotten this dashboard:

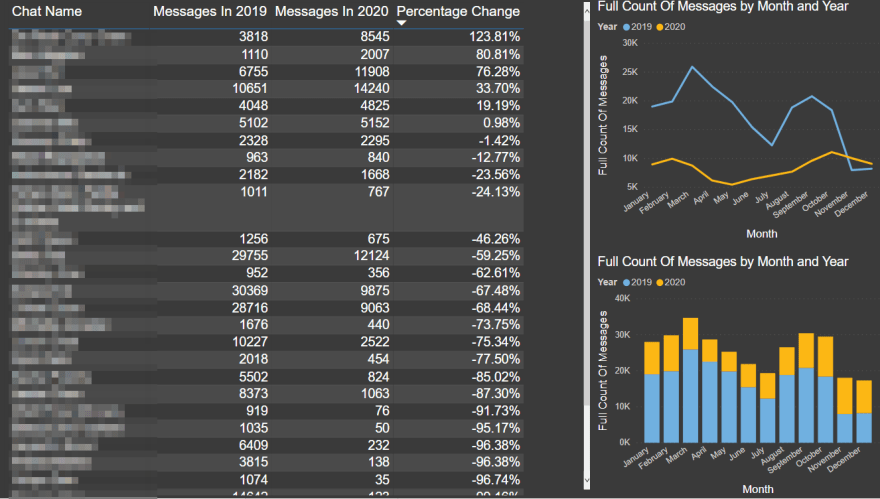
I also wanted to do a more in detail comparison to see how I compared for each chat, so created a comparison dashboard as well with same measures but different visualisations.
Initially I got a whole table, with massive percentage changes for people who I don't talk to much. I.e. If I only did 5 messages with them in 2019 but 50 messages with them in 2020, that will show a 900% increase which is a little misleading, so filtered it so that there were atleast 750 messages in 2019/2020.
Creating a Friend Profile Dashboard
I wanted to see how a particular friend chat was. The main things I wanted to see were:
- Number of messages
- Type of Messages
- Rank
- Breakdown of the messages
- Trend over time
- Number of reactions sent
- When I first/last talked to them
The complex part was the rank. I knew I had to use the RANKX function. To do this, I created a separate table called Group Chats with each distinct chat, got the total count of messages, and then created a column to determine the rank. That way it will be fixed and it wont change by filters. (I am sure there is a better way, but for now that is how I did it). I only wanted to include regular chats rather than group chats.
Rank = RANKX(FILTER(GroupChats,GroupChats[Type] = "Regular"),GroupChats[CountOfMessages])
I also created a little drop down slicer to identify the chat. This has to be the thread path as that is the unique id. Some chat titles are the same and can not be used.

We got it!
Now we can redownload different periods when need to and just import it in and PowerBI should automatically load everything and get the insights instantly!
Things I would do differently for next time
- I would use a list to import the various JSONs rather than a master JSON file, this will allow it to be easier to add on new small files when needed, rather than joining everything again from scratch
- JSONs arent really the best for powerbi imports and there are a lot of empty data rows when it gets expanded. I would try and use the JSON to create a relational db and then perform the joins within power BI. This would also mean I dont need to create bandaid measures such as distinct amount of messages as it would already be like that in the relational db
- Design wise, there were a few stuff which wasnt as useful. Like the previous project, I would work with UX designers to get a good thought out dashboard
- I would also try and learn more about DAX commands and using the advanced editor. Most of the things I did was GUI based, I would prefer to learn DAX and that would open up many more possibilities
- One thing I wanted to see was the response rate, this was quite hard now as you can't really tell when a convo is finished or not. Having a RDS would make things easier as you can see the timings between the messages, but will need to know when a convo is finished or not. Maybe using NLP?
- The reactions are in a non-UTF format and hence are coming out a little weird. I would need to build a translator to make it much nicer to read and see the trends
Conclusion
It was amazing and fun to play around with power bi with facebook data to see how you talk to friends and stuff. Will definitely want to do more with power BI or the other visualisation tools such as Tableau.

Top comments (0)
Some comments may only be visible to logged-in visitors. Sign in to view all comments.