webMethods API Gateway version: 10.12 and above
Problem Statement
Monitoring a complex landscape is not easy!

For many years, we “monitored” software systems because we expected it to behave a certain way. What’s worse? We expected them to fail in specific ways, so we can keep a tab for such specific failures.
An “explicit, predictable failure” centric approach to monitoring becomes a problem when the number of “things that can go wrong” exponentially increases. As we adopt increasingly complex architectures, we often hear that we live in an era when failure is the norm.
Why is it extremely hard to monitor and troubleshoot?
Monoliths are giving way to distributed systems: API Gateways, microservices, serverless, meshes, proxies, and every possible combination. These systems enable development teams to build new features and technology faster.

But these distributed systems present unique and often, difficult operational, and maintenance challenges.
When something breaks, it can be difficult to restore service quickly, or even know where to begin. How can you parse through sprawling dependencies - APIs, their versions, microservices, databases, cloud providers, managed services, and everything else that could be causing an issue or affected by another?
How many times have we come across these common questions?
- Why is my API broken?
- Is this issue affecting certain API consumers or all of them?
- What is system performance like for our most important consumers?
- How did my service look like at time-point x?
- Why has performance degraded over the past quarter?
- What is most likely contributing to latency right now? What is most likely not?
- What services does my API depend on — and what services are dependent on my API?
- What logs should we look at right now?
- What went wrong during/after the recent release?
- Should we roll back the latest release?
- What changed? Why?
We need more than traditional logs and infrastructure metrics, in order to manage and understand the multi-layered architectures.
Which brings us to the question — and the central focus of this article — how can we effectively operate, and manage the API Management, one of such distributed systems?
The Solution
Observability extends the classic monitoring systems to let you answer questions, not just hear that something is wrong. Observability is also about getting answers to questions that we didn’t know we’d have to ask.
There is a culture change around monitoring that comes with a shift to cloud-native. Although applications in both on-premises and cloud-native environments are expected to be highly available and resilient to failure, the methods that are used to achieve those goals are different. Instead of monitoring to avoid failure, we monitor to manage failure - and that is quite a shift in our thinking.
Monitoring != Telemetry != Observability
It’s not a topic of comparison (vs.), rather, they complement each other.

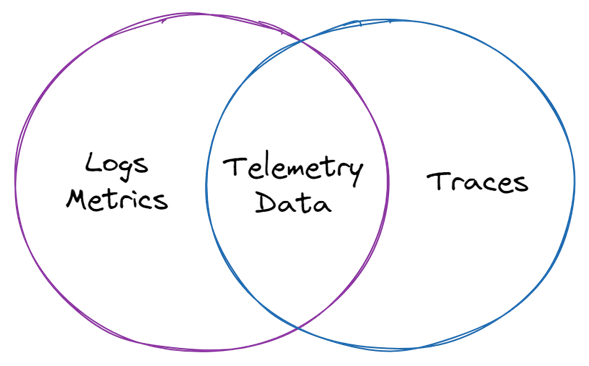
Telemetry is the feedback you get from your production systems that tells you what’s going on in there – things like logs, metrics, traces. Observability is not simply telemetry — it’s how that telemetry is used to solve problems and ultimately create a better experience for the customers.
Monitoring a dynamic modern-day landscape requires each participant to be observable. Each entity must produce appropriate data to support automated problem detection and alerting, manual debugging when necessary, and analysis of system health (historical trends and analytics).

Monitoring API Gateway
We got probes for the job!
In a highly-available architecture, multiple instances of each API Gateway component will be run to operate as a cluster. This avoids a single-point-of-failure and involves multiple nodes (e.g., virtual machines or Kubernetes pods). The typical monitoring scenarios are covered in the below table:
| Requirement | Impact | Solution |
|---|---|---|
| For API Gateway, is there an endpoint that returns ‘yes’ or ‘no’ about its service availability, that is, it’s readiness for serving the incoming API requests? | Business Impact. To know if there is an outage in API Gateway. | Use Readiness Probe |
| For API Gateway, is there an endpoint that indicates the availability of the administrator user consoles? | Operational Impact. To know if the administrator user console is available. | Use Administration Service Health Probe. |
| For API Gateway, is there an endpoint that indicates the cluster health and its details? | Technical Impact. To know the details about where the fault lies when there is a cluster failure. | Use Runtime Service Health Probe. |
Key points:
- Service Availability refers to the availability of access and functionality of the API Gateway (e.g., serving API requests). Service Availability must be measured at the cluster level (e.g., 1 node down does not mean a service outage).
- Node health refers to the ability of a particular instance to serving the functionality (e.g., serving API requests). Node health must be dealt with in isolation by setting up probes per instance of each component.
For detailed documentation, please refer Monitoring API Gateway.
Observability
We got metrics for the job!
API Gateway emits the following application metrics:

API Gateway also provides metrics for the API calls, error, and error rates:
The API-level monitoring measures the availability of the deployed APIs. For example, error rates and performance (latency). You can use these metrics to measure the service and business availability.
The key metrics monitored are:
- Error rates
- API transaction error rate per API and the aggregated value
- API execution error rate per API and the aggregated value
- Backend API errors per API and the aggregated value
- Errors arising from the inter component interactions (such as API Gateway to Elasticsearch)
- Performance (latency)
- API performance per API
- API Gateway performance and Backend API performance
- Aggregated latency introduced by API Gateway
The API-level metrics you monitor have the following characteristics:
- The metrics continue to exist when an API is deactivated or activated.
- The metrics for a deleted API are no longer reported.
Also, note:
- The metric count starts from zero when the server starts.
- The API invocations are counted per node and not for the complete cluster.
- The API invocations are counted only within an API Gateway instance.
- After scraping, that is after sending the /metrics request, all Gauge values are reset.
And there is more! There are server-level metrics that allow you to monitor the API invocation errors due to inter-component connectivity.
For detailed documentation, please refer API Operational Metrics.
Develop and rollout your APIs to production in minutes. Get started with our Free Forever Edition: Sign up - Software AG Cloud
1 post - 1 participant

Top comments (0)