
This week we're going to look at some tools that report various CPU, memory, and disk metrics on Linux servers. You will want to ensure that these are all installed on production systems for convenience when there's a problem.
Viewing the system load
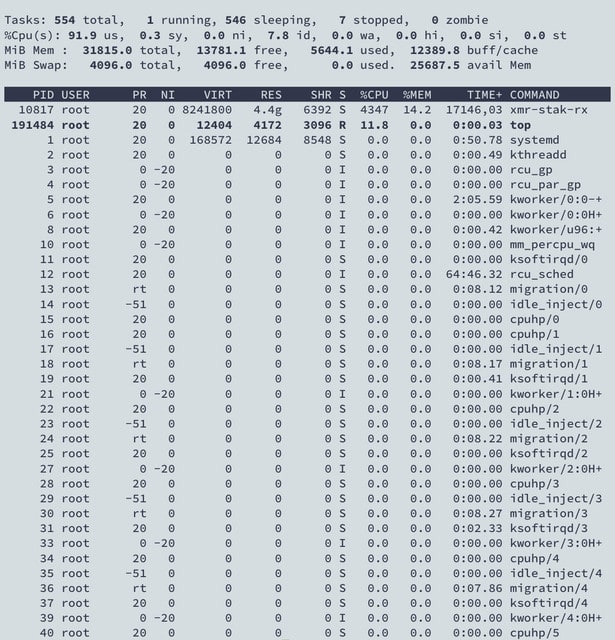
System load is a metric defined by the average amount of CPU used per minute. In addition to per-minute system loads, Linux also tracks 5- and 15- minute system loads. These can all be viewed by the uptime or top utilities. In the case of top, the system load is shown on the first line, on the right.
On the left of both of these tools, you can see the system uptime, which is how long the operating system has been running, on the left, immediately to the left of the system load.
Now typically, when you see a high 1-minute system load but low 5- and 15-minute loads, then that means the system was idle until just now when something started to consume a lot of CPU. Generally speaking, these intervals may not provide enough granularity for everyone, so what people usually do next is run the uptime or top commands in quick succession, but a better tool that precisely records the system load in fine-grained intervals is sysstat.
Configuring sysstat
The sysstat configuration file lives in /etc/default/sysstat on Debian systems and /etc/sysconfig/sysstat on Red Hat-based systems. To enable sysstat, you need to make sure that the ENABLED= line has a value of “true”. Add it if there is no such line. Then run
systemctl enable sysstat
systemctl start sysstat
Sometimes, you have to install sysstat from your distribution's package manager before you can enable it.
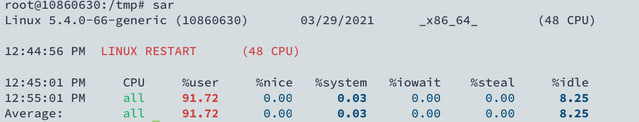
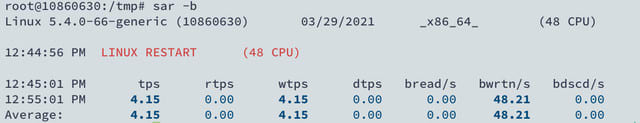
Once it's enabled, sysstat will take care of the job of periodically recording statistics to a file. This file is rotated to a new filename each day. The records can be viewed using the sar tool. By default, it will show CPU statistics, but the -r option makes or show memory stats, and the -b option makes it show disk stats, and finally, the -A option makes it display all available statistics.
Let's take a look at the kind of metrics you can expect to get from sar.
CPU metrics
- User time and system time refer to the amount of time spent by user-mode processes (the vast majority of processes) and fielding system calls to the kernel, respectively.
- I/O wait time refers to the amount of time processes spend waiting for disk I/O. This also includes network I/O because, in Linux, the network read/write functionality is implemented as a block device backed by a respective kernel driver.
- Niced time measures the user time of processes that have been re-niced, which refers to the changing of processes’ execution priorities.
- Steal time measures the amount of CPU time “stolen” by a hypervisor to yield for other host processes. It’s only meaningful for virtual machines and containers because this metric is usually zero on physical hardware.
- There’s also hardware interrupt and software interrupt tome that’s spent in the kernel, servicing these two events.
- Finally, idle time has the most straightforward definition, and it's the amount of time the system hasn’t been doing anything.
All of these metrics can be found not only in sar’s output but also in top’s as well.
Memory and disk metrics
sar’s memory metrics are pretty straightforward, with columns for kilobytes of RAM and swap used and free, the percentage of used RAM, and how much of the RAM is being used for cached purposes.

Finally, its disk metrics tell you how many reads and writes were done per second and how many bytes were read or written to disk on average. These can also be viewed by the iostat tool, whose output is similar to sar -b's except it displays the values per device.

Oldest comments (0)