
What is this?
Having recently fallen in love with Svelte, I have dove into it on the deep end. And let me tell you, it is awesome! With these short posts, I aim to explore some of the less covered topics that I encounter as I write stuff in Svelte.
Example repository can be found here.
Alright, it's time to dig in... Thirty seconds, go!
SVG Components
Rich Harris, the creator of Svelte, is was a graphics editor at the New York Times, and so you'd be excused for thinking that Svelte would make SVGs easy. The truth is, that's not always the case (as is true for other libraries and frameworks). However, Svelte does provide some powerful tools for working with SVGs.
The Basics
A common usecase is to import svgs from a static file wrapped in an <svg> tag, using the <use> tag with the href="/some-svg.svg"-attribute. This does not work with Svelte, at least not as it is. This would require a few extra steps involving a <symbol> tag and an id attribute in the original SVG, and ultimately it is not a very flexible.
Importing the SVG-file in the <script> tag is also a common way to attempt to do this, but this solution also requires some extra steps.
In fact Googling this issue will yield a number of solutions. One solution, however, I would propose is superior to the others (and it is an easy one to implement).
Simply renaming your SVG file from a .svg to a .svelte and importing it as a component is pretty much all you need to do. I have to admit I balked at this solution at first as I prefer to keep my SVGs as .svg files. Yet, this opens a world of possibilities, most notably enabling dynamic SVGs.
Let's start with a simple example:
<!-- line-chart.svelte -->
<svg
    version="1.2"
    xmlns="http://www.w3.org/2000/svg"
    width="100%"
    height="100%"
    viewbox="0 0 1000 1000"
>
    <path d="M1 0v300" class="grid x-grid" stroke="#111" stroke-width="2" />
    <path d="M1 299h600" class="grid y-grid" stroke="#111" stroke-width="2" />
    <g stroke="black">
        <line x1="0" y1="170" x2="100" y2="190" />
        <line x1="100" y1="190" x2="200" y2="120" />
        <line x1="200" y1="120" x2="300" y2="180" />
        <line x1="300" y1="180" x2="400" y2="200" />
        <line x1="400" y1="200" x2="500" y2="100" />
    </g>
</svg>
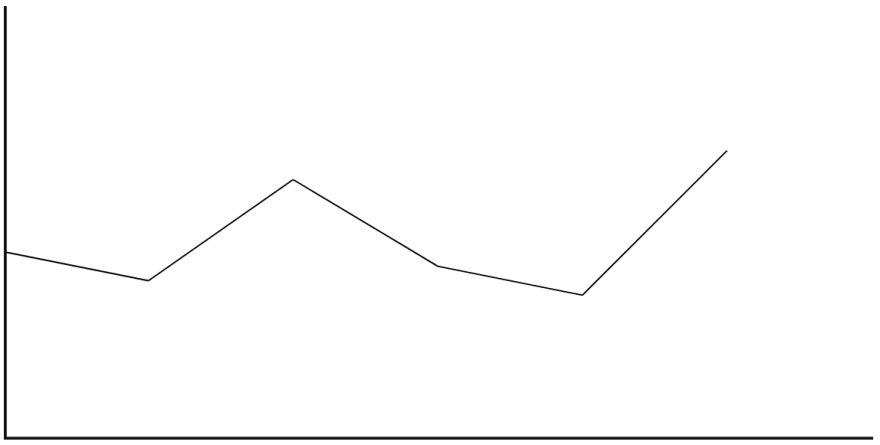
This produces a rather crude line chart like so:
And we import it simply as a component:
<!-- index.svelte -->
<script>
    import LineChart from "path/to/line-chart.svelte";
</script>

<LineChart />
Easy!
I Have the Power!
You might be seeing where this is going. Since the SVG is now a Svelte component, this means we can treat it like any other svelte component and it will still produce an actual SVG.
Taking programmatically generating SVGs to the next level!
How about:
<!-- line-chart.svelte -->
<svg
    version="1.2"
    xmlns="http://www.w3.org/2000/svg"
    width="100%"
    height="100%"
    viewbox="0 0 1000 1000"
>
    <g class="labels">
        <text x="50" y="320">2008</text>
        <text x="150" y="320">2009</text>
        <text x="250" y="320">2010</text>
        <text x="350" y="320">2011</text>
        <text x="450" y="320">2012</text>
        <text x="250" y="340">Year</text>
    </g>
    <g class="labels y-labels">
        <text x="40" y="10">300'</text>
        <text x="40" y="100">200'</text>
        <text x="40" y="200">100'</text>
        <text x="40" y="300">0</text>
        <text x="20" y="150" class="y-label-title">Price</text>
    </g>
    <path d="M50 0v300" />
    <path d="M50 299h500" />
    <g stroke-dasharray="0 4 0">
        <line x1="50" y1="170" x2="150" y2="190" />
        <line x1="150" y1="190" x2="250" y2="120" />
        <line x1="250" y1="120" x2="350" y2="180" />
        <line x1="350" y1="180" x2="450" y2="200" />
        <line x1="450" y1="200" x2="550" y2="100" />
    </g>
</svg>

<style>
    svg {
        --color: #111;
    }

    line,
    path {
        stroke: var(--color);
    }

    .labels {
        font-size: 12px;
        font-family: sans-serif;
        text-anchor: start;
    }
    .y-labels {
        text-anchor: end;
    }

    .y-label-title {
        text-anchor: start;
        transform: rotate(90deg);
        transform-origin: 2% 14%;
    }
</style>
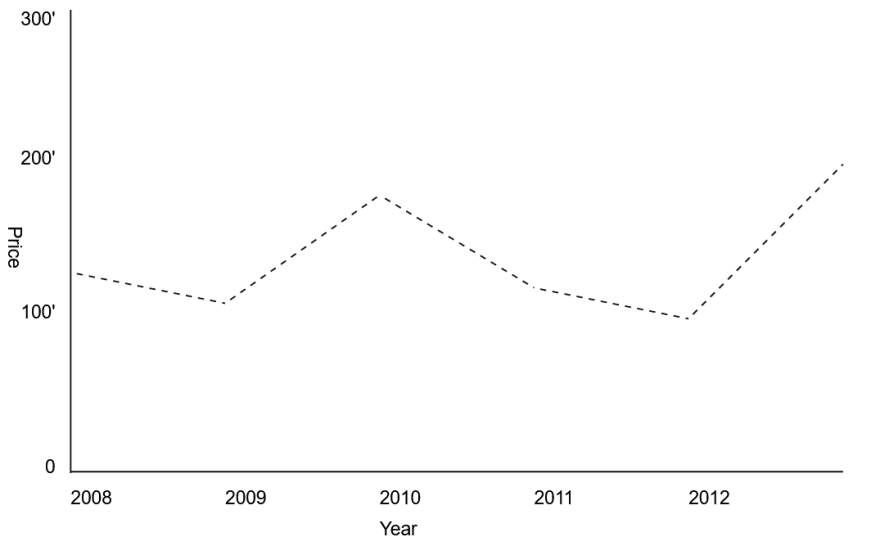
Now our SVG looks more like this:
Data Driven SVGs
Taking the previous example, let's look at how we can dynamically generate the SVG. This is where the magic happens. What if we want to dynamically generate the y-axis data of each data point based on actual data passed into the component? Let's say we have a dataset of prices for each year. We can then use this data to dynamically generate the y-axis data like so:
<!-- line-chart.svelte -->
<script>
    export let prices_by_date = {
        y2008: 170,
        y2009: 100,
        y2010: 160,
        y2011: 120,
        y2012: 130,
        y2013: 200,
    };

    let y2008, y2009, y2010, y2011, y2012, y2013;

    $: ({ y2008, y2009, y2010, y2011, y2012, y2013 } = prices_by_date);
</script>

<svg
    version="1.2"
    xmlns="http://www.w3.org/2000/svg"
    width="100%"
    height="100%"
    viewbox="0 0 1000 1000"
>
    <g class="labels">
        <text x="50" y="320">2008</text>
        <text x="150" y="320">2009</text>
        <text x="250" y="320">2010</text>
        <text x="350" y="320">2011</text>
        <text x="450" y="320">2012</text>
        <text x="250" y="340">Year</text>
    </g>
    <g class="labels y-labels">
        <text x="40" y="10">300'</text>
        <text x="40" y="100">200'</text>
        <text x="40" y="200">100'</text>
        <text x="40" y="300">0</text>
        <text x="20" y="150" class="y-label-title">Price</text>
    </g>
    <path d="M50 0v300" />
    <path d="M50 299h500" />
    <g stroke-dasharray="0 4 0">
        <line x1="50" y1={300 - y2008} x2="150" y2={300 - y2009} />
        <line x1="150" y1={300 - y2009} x2="250" y2={300 - y2010} />
        <line x1="250" y1={300 - y2010} x2="350" y2={300 - y2011} />
        <line x1="350" y1={300 - y2011} x2="450" y2={300 - y2012} />
        <line x1="450" y1={300 - y2012} x2="550" y2={300 - y2013} />
    </g>
</svg>

<style>
    svg {
        --color: #111;
    }

    path {
        stroke: var(--color);
    }

    .labels {
        font-size: 12px;
        font-family: sans-serif;
        text-anchor: start;
    }
    .y-labels {
        text-anchor: end;
    }

    .y-label-title {
        text-anchor: start;
        transform: rotate(90deg);
        transform-origin: 2% 14%;
    }
</style>
This is but one simple example of how we can dynamically generate SVGs. And much is still hardcoded. A recent tweet by @joshnuss displays a much more sophisticated example of this same idea. I recently published a component that builds on the same principles to produce Squircle-type shapes.
Hope this was a bit insightful. If you have any questions or comments, please let me know!
Bonus!
Svelte has a curious feature called <svelte:options namespace="svg">, and it is not well documented (beyond indicating that you force a namespace).
What it does and what it is intended for is to force the compiler to use the SVG namespace when generating the component, regardless of what tags you are using in the component. For example should you use a div in your svg component the compiler will create it using the document.createElementNS method as opposed to just document.createElement. This might be helpful in instances where you are using non-standard tags in your SVG, and there are issues with your SVG, or you are seeing unexpected behavior. Beyond that, you do not need to declare this namespace in your component as Sveltes compiler is smart enough to figure out what namespace to use in most instances.

Oldest comments (0)