
Azure SQL Hyperscale is the latest architectural evolution of Azure SQL, which has been natively designed to take advantage of the cloud. One of the main key features of this new architecture is the complete separation of Compute Nodes and Storage Nodes. This allows for the independent scale of each service, making Hyperscale more flexible and elastic.
In this article I will describe how it is possible to implement a solution to automatically scale your Azure SQL Hyperscale database up or down, to adapt to different workload levels dynamically and automatically without requiring any manual intervention.
Now, first things first. I will not go into details here, as they are well described in the official doc, but it is important to understand how the SQL Server engine has been refactored into Azure SQL Hyperscale, as it is the foundation for a fast scale up and down of the selected service tier. Here is a picture that explains it very well:
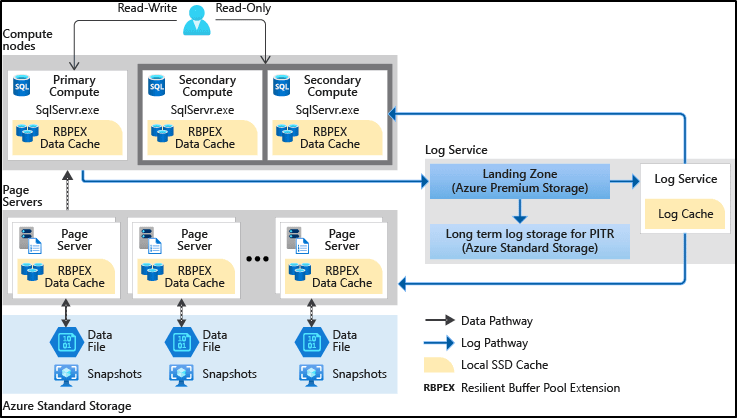
One of the main benefits of this architecture is that scaling up or down the Service Level Objective, which means cores and memory, is something completely unrelated to the size of the database. Let's say, for example, that you want to move from an HS_Gen5_2 to HS_Gen5_4. This is an overview of what is happening:
- A new Hyperscale compute node, with the newly requested Service Level Objective, has been created.
- The new compute finishes the initialization process and gets in a ready state.
- Existing connections in the active compute node are terminated and running transactions are rolled back or awaited to finish.
- New connections are routed to the new node.
- The old Hyperscale compute node is no longer used for this database.
As there is no data movement involved, this workflow happens quickly. In several tests I ran lately, I had a constant value of a maximum of 2 minutes to spin up a new compute node of the Service Level Objective you are asking for, and something around 12 seconds to switch the control to the newly created node.

For all the time needed to spin up the new compute node, all existing connections still are open and transactions against the database are processed as usual. It's only during the 12 seconds of switch that, at some point during that time range, connections will be moved to the new compute node. If you have a long-running transaction being executed at the time of cut-off, it will be rolled back: thanks to the new Accelerated Database Recovery, this operation will be almost immediate, and it will not prevent the scaling action from being completed. Of course, it is always good to avoid re-running transactions, as they may be resource-intensive, so follow the best practice to keep the connection open only for the time needed. If you are used to working with HTTP and REST, you are already doing this: just keep doing the same with Azure SQL too. If you are using some tool like Dapper, you don't even have to bother about managing connections, unless you have some specific requirements. It will automatically open the connection just before you run a command, and automatically close it once the command is done. This is all you need to write:

Monitoring Resource Usage
Azure SQL databases provides a useful DMV, sys.dm_db_resource_stats, to monitor resource usage:

It keeps data for about 1 hour, aggregated by 15-seconds buckets. With such data, it would be possible to do some fancy stuff using machine learning and some cool forecasting algorithms, but for the sake of simplicity, we will use a very simple moving average to smooth out peaks and figure out if we need to scale up our Azure SQL Hyperscale database. If you are interested in better algorithms to decide if you need to scale up or down, you will find some links and resources at the end of this post.
For now, we can use a window function to calculate the moving average over the last minute.
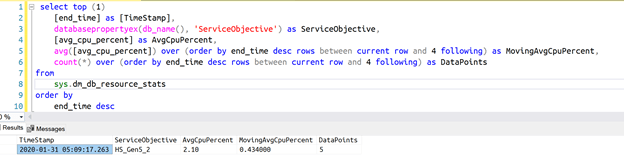
Aside from the moving average, the query will also return the number of data points used to calculate the average. This is useful when determining if scale up or down action should really happen. In fact, just after a change of Service Level, say from 2vCores to 4vCores, the used DMV will be completely empty. So, for one minute, you will have an average calculated on way less data that what you want...and this could lead you to make wrong assumptions about the real resource usage. Due to the application reconnecting to the database, the first seconds could be even without load...and you should not take any action (for example scaling down) based on that incomplete set of data. For this reason, the sample solution will ignore all actions suggested by a dataset that doesn't have at least a minute of data.
If you want to calculate the moving average over a longer time duration, to smooth out very short spikes of workload that could trigger unwanted scaling actions, you can just increase the number of data points, keeping in mind that each data point represents 15 seconds of workload. This is the code you want to look at:
![]()
As you can see, it now takes the current data point plus the 4 earlier data points (as data is ordered in descending order by time).
In case you need more than one hour, you can use the sys.resource_stats view, where data is stored, with a 5-minute granularity, for 14 days.
Look at OVER Clause documentation to understand what other options you have and how it works.
Autoscaling up or down
Now that we have a simple algorithm that will tell us when scale-up is needed or when scale-down is recommended, we just have to implement a monitoring job that will get such data and kick off the scaling operation.
This can be done using Azure Functions, as they support Timer Triggers, which will allow us to do exactly what we want.
Every 15 seconds the Azure Function will wake up and will get the current performance data from an Azure SQL Hyperscale database, along with the 1-minute moving average. If the moving average is within some defined boundaries it will go back to sleep. Otherwise, autoscaling action will be started. Here's an example of such Azure Function in action, logging into dbo.Autoscaler table so that it is possible to check what happened and why:
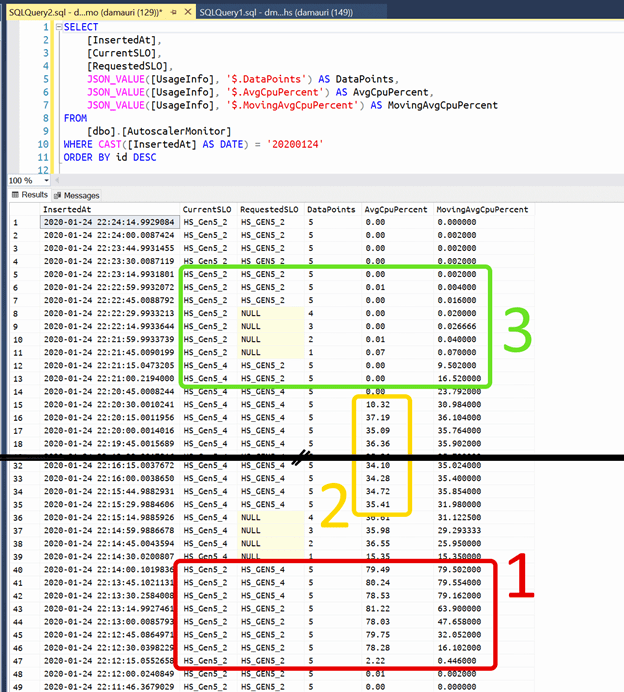
As visible in the picture above, in the red box (box "1"), around 22:12 GMT a workload spike began, bringing Azure SQL Hyperscale CPU usage close to 80%. After a minute of this sustained workload, the moving average went over the 70% boundary and thus the autoscaler started to request a bump in the Service Objective, asking for a scale up to 4 vCores.
The scale-up happened within 30 seconds and then autoscaler waited for the warmup of the new Service Objective to finish (the NULL values in the RequestedSLO column), as during warmup too few data points were available to make any decision. Once the number of data points was 5 again, it started to evaluate the workload and found that 4 cores were enough to handle the existing workload. In fact, in the yellow box (box "2"), you can see that CPU usage is half of the value existed before, when the workload spike started.
One thing that is important to keep in mind, is that every time that scale up or down happens, the local RPBEX cache will start fresh. If the workload is critical, this can have an impact on initial performance, as data needs to be pulled from page servers into the local compute node cache. To help the cache to be warm as fast as possible you may want to execute some specific query as part of the autoscaler solution, just to make sure the most-used data is in the local cache. This is not a requirement and really depends on the workload you have but is some cases can really help a lot to boost the performances after the new Service Level Objective is ready to be used, so keep this option in mind if you see slower than expected performances just after scaling up or down happens.
At a later point, around 22:20 GMT the workload spike ends and, in a minute, the autoscaler detects that 4 vCores are now even too much for the current workload and initiates a scale-down to 2 cores (green box, number "3").
Simulating workload
To simulate a simple workload, you can use powerful load testing tools like Locust, K6 or Apache JMeter where you can simulate even the most complex and realistic workload. To create a simple workload, a nice tool originally written by Adam Machanic is also available: SQL Query Stress.
Albeit quite old now, it allows you to execute a query using the desired number of parallel threads, so that you can create some workload in the database. It is very easy to use, configurable enough and is great to quickly test the autoscaling sample. In fact, a .json configuration file is also included in autoscaler's GitHub repo, so you can get started right away.
Source Code
Sample source code is available here. If you want to contribute, by adding some of the improvements described below, please feel free to do so. I'll be more than happy to accept contributions to this repo.
Improvements
Using the moving average to figure out if Azure SQL Hyperscale tier should be scaled up or down can be a little bit too simplistic if you have a scenario where workload can vary with very complex patterns. It works well when you have a situation where the workload spike endures for a consistent amount of time, and if your workload fits that use case, great! Just keep in mind that in the sample we're only monitoring CPU usage, but there are also data and log IO usage that could be monitored. As you can guess, what you want to monitor, and how you want to use that data to activate the scale up or down, is up to you and very specific to your workload scenario.
As mentioned already, this is just a sample, and it should be used a starting point to create something there fits your own use case. But that\'s the only improvement you can think of.
In fact, the current sample just reacts to an increased or decreased workload...which means that it will starts to take an action when the workload has already started to change. If the workload spike is huge, the allocated resources may not be able to satisfy it within the desired performance SLA you must guarantee, as scaling will happen because of that workload change, and sometimes even causing a larger impact due to the necessary failover during the spike.
Another approach would be to try to be proactive and predict the workload so that the Azure SQL Hyperscale tier could be changed before the spike happens, and thus always guaranteeing the best performance possible.
Machine learning is an option in this case, of course, as well other existing prediction algorithms. A nice blog post on how Netflix approaches to this problem is available on their blog: Predictive Auto Scaling Engine.
More in general the problems fall under the umbrella of "Demand Forecasting" and there are already some cool algorithms in Azure Machine Learning services:
If you want even more options this blog post is amazing: Time Series in Python, Exponential Smoothing and ARIMA.
Azure Machine learning can be easily integrated with Azure Functions, and you can really create spectacular solutions using Azure SQL Hyperscale, Azure Machine Learning and Azure Functions.
Alternatives
There are two alternatives to the proposed sample. The first is to use Azure Alerts, where you can do the same as described here, but without writing code. Just be aware that the telemetry log available to Azure Alerts have some latency -- usually between 2 and 5 minutes -- which means that response to workload spike will be not as fast as polling the database DMV as the sample does. If you don\'t need to respond to workload spikes in less than 5 minutes, Azure Alerts can be a great, simpler, alternative.
Another "sort of" alternative is to use Azure SQL Serverless database, which incorporates scale up and down natively.
I said "sort of" because the Serverless option is not available to Azure SQL Hyperscale now so it is not really an alternative, but if you are fine using the General Purpose service tier, you'll get autoscaling right away, just by configuring it.
Conclusion
Autoscaling a service is a challenging job, especially if the workload is not easy predictable. But thanks to Azure SQL Hyperscale elasticity and quick scalability this can be done using an Azure Function, with minimal service interruption, especially if following the best practices and implementing correct connection retry logic. Remember also to use the latest .NET driver as they already implement some reconnection logic that in several common cases will make the reconnection completely transparent.

Top comments (0)