If you've ever wondered "Will my project build faster with 8 gigs of ram vs 4" then this article is for you.
Today we'll be talking about the standalone gradle-profiler tool. There's a nice little intro into using it here: https://developer.android.com/studio/build/profile-your-build but a lot of the stuff there still went over my head. I am but a measly android developer, who still feels like I need a PhD to understand gradle.
I've got two typical scenarios I want to test that I run into every day.
- Builds after a clean
- Incremental builds
Builds after a clean seem to take my project around 3 minutes on average. This is completely unmeasured, but mostly this is what I see in the bottom right hand corner in Android Studio "You build finished in 3 minutes and 02 seconds". Going through a clean is pretty popular for me because sometimes things just don't work in the IDE (I think a lot of it is/might be due to kapt), but regardless I have to clean/invalidate caches/restart/hope that my build is fixed. And then re-run. This is the scenario I want to test first.
Install gradle-profiler
git clone https://github.com/gradle/gradle-profiler
    && cd gradle-profiler
    && ./gradlew installDist
Edit: Now available on brew
brew install gradle-profiler
CD into the gradle-profiler
CD into the profiler build/install/gradle-profiler/bin
Create a scenarios.txt
A scenarios.txt lists all of the scenarios that the gradle-profiler will run through. I found that the one that is in the Android Studio docs wasn't that helpful to me in testing my first scenario. I did get a ton of help from Paul Merlin who works on the Gradle team.
This is mine
clean_build_1gb {
    tasks = [":app:assembleFreeDebug", "--rerun-tasks"]
    jvm-args = ["-Xmx1024m", "-Dkotlin.daemon.jvm.options=-Xmx1024m"]
}

clean_build_2gb {
    tasks = [":app:assembleFreeDebug", "--rerun-tasks"]
    jvm-args = ["-Xmx2048m", "-Dkotlin.daemon.jvm.options=-Xmx2048m"]
}

clean_build_4gb {
    tasks = [":app:assembleFreeDebug", "--rerun-tasks"]
    jvm-args = ["-Xmx4096m", "-Dkotlin.daemon.jvm.options=-Xmx4096m"]
}

clean_build_8gb {
    tasks = [":app:assembleFreeDebug", "--rerun-tasks"]
    jvm-args = ["-Xmx8192m", "-Dkotlin.daemon.jvm.options=-Xmx8192m"]
}

clean_build_16gb {
    tasks = [":app:assembleFreeDebug", "--rerun-tasks"]
    jvm-args = ["-Xmx16384m", "-Dkotlin.daemon.jvm.options=-Xmx16384m"]
}

clean_build_32gb {
    tasks = [":app:assembleFreeDebug", "--rerun-tasks"]
    jvm-args = ["-Xmx32768m", "-Dkotlin.daemon.jvm.options=-Xmx32768m"]
}
As you can see, I test from 1 to 32GB (my machine has a lot of ram), and I set the JVM args and kotlin jvm args to that same amount. I suppose that it would be good if I could tweak both of them to variable and just run this overnight and somehow have it run in a bunch of combinations to see what works best, but I haven't figure out how to do that yet.
You can note that I also added "--rerun-tasks" argument because according to (Paul Merlin)[https://github.com/eskatos] this means "If you want to benchmark a "rebuild everything" scenario you can ... use --rerun-tasks."
Run the profiler
./gradle-profiler --benchmark --project-dir ~/dev/rollertoaster --scenario-file ~/dev/rollertoaster/scenarios.txt
This runs the profiler, pointed at my project file, and points it at the scenarios file in my project. (I'm saving the scenarios there so that other people on my team can easily benchmark and update their local gradle.properties file. The entire thing that has caused me to really try the profiler was the fact that my CI has wildly different ram, vs my desktop, vs my laptop, and all of us adhering to a single gradle.properties felt stupid)
After
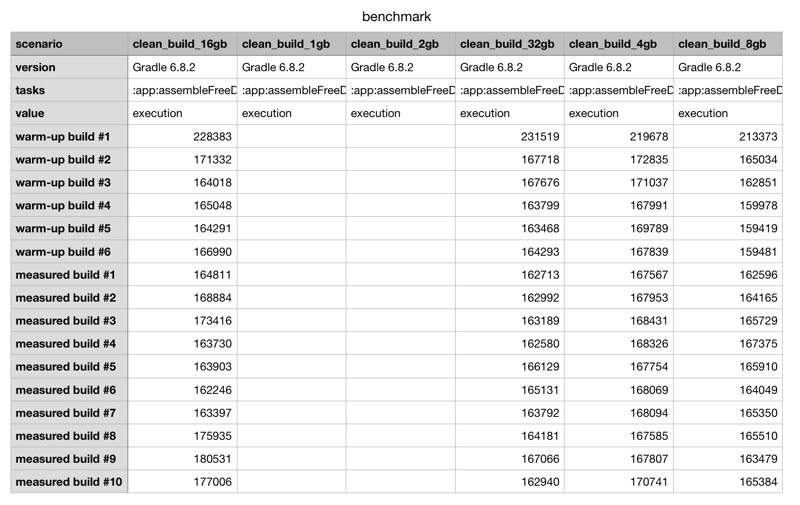
Running the profiler could take some time as it runs a few iterations, but it will eventually give you a directory to open. In this directory you'll have an html document and you can pretty much look at the "Mean" column and choose the fastest one for you. Here I'm showing the .CSV output and you can see that my 1GB and 2GB builds failed completely, but to my surprise there wasn't much difference in adding RAM after 4GB.
Then try no-op scenario.
From Tony Robalik
It is named noop (for "no-op"), which runs the :app:assembleDebug task. I call it "no-op" because there are no file changes in this scenario, so every assemble after the first should be a "no-op." This scenario tests whether your primary daily task is well-configured: the task and all its dependencies should all be UP-TO-DATE; this build should be very fast.
noop {
  tasks = [":app:assembleDebug"]
}
Next up, incremental changes!
IN PROGRESS
Thanks to Adam Bennet's article that introduced me to gradle-profiler and how simple it was to get started.
Also see: https://dev.to/autonomousapps/benchmarking-builds-with-gradle-profiler-oa8
I use this:
https://gist.github.com/ColtonIdle/6122faf5aa99740fe8e61487e9a60f27

Top comments (0)