
How to Build a Data Analysis Tool In 4 Steps
Data analysis can be tricky. First you need a you need to actually collect your data. But an issue many people struggle with is presenting this data in a comprehensible form. Many turn to Excel and use Excel's charting features to display their data but it often turns into an ugly mess. Another thing is Excel struggles with larger datasets which means your spreadsheet just turns into a slow and cumbersome headache.
That's why there's now tools to help you take your data and present it in a way which is easy to understand and also professional.
In this article, we'll show you how to build a data analysis tool in just a few steps.
Why Build a Data Analysis Tool
Today, we'll explore how to build a data analysis tool and discuss why you might need one. Whether you're an academic presenting a data study, someone looking to present data more efficiently, or just entering the world of data sciences (PS: for data entry jobs, check out Jooble), modern tools can help you achieve this effectively.
In this tutorial, we'll focus on using one of these tools called Five.
Five is a modern data analysis tool that allows you to import your dataset, create custom visualizations, and add various features. Unlike traditional data visualization tools, Five lets you build a full-blown web application hosted on a domain of your choice. This means you can incorporate more web application-type features compared to traditional data visualization tools.
Depending on your needs, this could be either a benefit or a drawback. If you're simply looking for beautiful charts and don't need additional features to enhance your data presentation, Five may not be the right fit for you. However, if you want to add custom features that can transform your dataset into a professional web application, you should consider signing up for a free trial of Five.
Five excels at creating data-driven web applications capable of handling complex and large datasets, something that traditional tools like Excel often struggle with. With Five, you can easily customize your web frontend using CSS and add code logic with JavaScript. The data import process is also straightforward; you can connect existing databases like MySQL or Excel/Google Sheets spreadsheets to Five and build your data analysis around them.
Security is another aspect where Five stands out. It offers advanced security features, including user authentication, data encryption, and access control, addressing concerns often overlooked by simple visualization tools.
Turning your data presentation into a modern web application, means you can customize your analysis to include specific features that meet the unique needs of your audience or project. Plus you can customize the look and feel of your application to align with your brand, creating a professional and cohesive presentation.
While traditional data analysis tools are excellent for quickly creating charts, they often fall short when building data-driven web applications which level up your analysis. Five bridges this gap, providing a solution for those who need to manage and display large amounts of dynamic data efficiently.
Steps to Build a Data Analysis Tool
Step 1: Choose the Right Tool
We're assuming you already have your dataset. If that's the case then you can dive straight in. Firstly, you need to select the correct tool such as Five.
Make sure to sign up for free access to Five and build your data analysis right inside your browser. Click the button below to get started!
Build Build a Data Analysis Tool
Rapidly build and deploy your data tool
You don’t have to pay anything to develop applications with Five. You only have to subscribe to one of our paid plans if you decide to host your application on Five’s managed cloud, which gives you a custom URL to access your application or share it with your application users. This makes Five a great tool for learners or those who simply want to explore a data analysis software.
Let’s start developing: launch Five using your personal development environment URL (contained in the email you have received after signing up).

TIP: Our User Community
If at any point you are hitting a roadblock or don’t know how to continue, check out our user community. Here you can find answers to the most common questions that people have when using Five. And, of course, you can get advice from our experts on how to develop applications with Five.
Step 2: Import Your Data
Click on Applications near the top left corner of the screen, and right below the hamburger menu icon.
Now, click on the yellow Plus icon. A new window “New Applications Record” will appear.
Give your application a Title, such as “Data Analysis Tool”.
Save by clicking the Tick Mark in the top right corner.
Here’s what your screen should now look like. If “Data Analysis Tool” is your first application, you will not see any other applications in the list on the left:

It’s time to build your database and import your data.
1. To start click the blue Manage button on the top right of the screen near the Five logo.
2. Now click on Data and then on Table Wizard.

Let’s go ahead and create our first database table.
- Give your table a Name. Let’s go with Inventory.
- Now click on the Plus icon on the right side of the screen. Click the plus icon four times to create four database fields:Field 1 will hold information about our products, so we give it the name Product and select text as its data type. We also give it a size of 100.Field 2 will hold information about Price. Its data type is float and its display type is float.2.Field 3, Quantity is an integer for its data and display type.Field 4, Total will be used to perform a calculation in the second part of the application development process.
- Save by clicking the Tick mark. Before you save, make sure that your table looks exactly like this:

Now let’s import our data from our Excel spreadsheet.
First, go to Data > Tables.
Now click on the Import CSV into Table icon to get started. It’s located to the left of the yellow plus icon with a small arrow pointing down into a box. See the image below to locate it:

To import your data make sure it is stored in a CSV file. If you’d like to use the data provided above, download our CSV file here.
- Five’s Import Data feature lets you select the database table you’d like to import data into.In our case, there is only one table: our Inventory table. So go ahead and select it from the dropdown box.
- Next, click on Choose File and find the Inventory.csv file. Upload it.
- Five will automatically map the fields of your CSV file to your database fields, provided you have been following this tutorial and your database fields have the same name as the top row of your CSV file.
- For InventoryKey select Generated. Five will now automatically generate a unique primary key for every record in your CSV file.
- For Total, select Not Imported from the dropdown box.
- Click on the Tick mark to upload your data.

Congratulations! You have now created a database table in a MySQL database and have populated it with data!
In the third and last step, we will add a form to our data analysis tool and launch and preview it.
Step 3: Previewing Your Data Analysis Tool
We have already created our application backend: a relational database with a single table that stores information about our products, prices, and quantities. But a database is not a web app. Our database needs a front-end or graphical user interface so that users can interact with the data.
Five makes it easy to build a form for your end-users. To get started, click on Visual and then on Form Wizard.
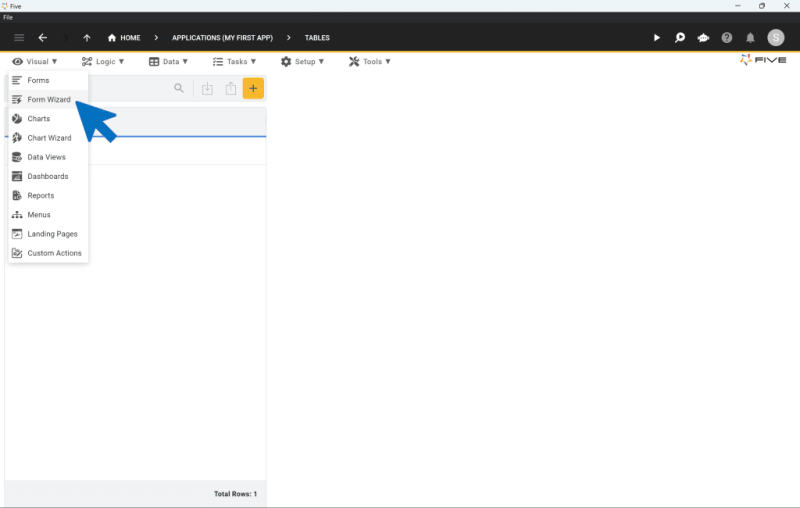
There’s only one thing you need to do in the form wizard. Select Inventory as your Main Table.
Save by clicking the Tick mark.

It is time to preview our application! Click deploy to development in the top right or if you've already done that press the play button.
Here’s what your application looks like:

Five gives you a fully auto-generated front-end, including the form that you have just developed using Five’s Form Wizard, as well as:
- A menu on the left,
- A search bar on the top,
- A filter next to your search to filter through your data, and
- The ability to add, edit, or delete records from your database through the graphical user interface.
In short, we have just created the first prototype of a web application that runs on a searchable online database.
To keep building this application, follow the next steps of this tutorial below.
Build Your Data Analysis Tool: Next Steps
Well done! You have successfully built and deployed your first web application in Five. Instead of managing your data in a spreadsheet, you can now use a modern data analysis tool to store, retrieve, and process your data. And it took only three steps to go from data to web app!
Five’s prebuilt user interface has automatically created an Inventories menu item for you. You can also see your Products in the list to the left of the screen. Last, by selecting one of the products, you can see its details, and make changes to them as necessary. Five also comes with a pre-built search and filtering feature.
Check out this screenshot of a finished application to get a sense of what’s possible:

Next, check out Part 2 of this guide and learn how you can add calculations to your application. For example, let’s calculate the Total field in our form.
You can also change the design of your application by adding a theme to it. This will make your web app look more professional and unique.
You can also add a login and terms & conditions consent screen to your application and give users different roles and permissions to access data.
With charts or dashboards, you can let users perform analytics - this one is especially relevant.
Last, you can show your data in an editable grid by following our Northwinds tutorial.
Remember how at the top we spoke about capturing clean data? Why not add a few data validation rules to your application?
In short, we have barely scratched the surface of what’s possible in Five! For further inspiration on what can be built in Five, visit our Use Cases or keep following our tutorial by adding a calculation to your application.

Top comments (0)