
Create customised Snowflake dashboards with DronaHQ
Create custom Snowflake dashboards with DronaHQ and visualize your business metrics and KPIs in real time. Import your data directly from Snowflake and create your own dashboards.
In this article, we will walk through the process of building a user interface for the snowflake dashboard on DronaHQ and integrating it with the employee database created in Snowflake to make an HR analytics dashboard.
What’s Snowflake and Snowflake dashboard?
Snowflake is a cloud computing-based data warehousing company based in Bozeman, Montana. The firm offers a cloud-based data storage and analytics service, generally termed "data warehouse-as-a-service". Snowflake enables you to build data-intensive applications without an operational burden. Snowflake dashboard combines the use of metrics and key performance indicators to produce a visually appealing chart or design giving you and your team ready access to the information you need to continually improve business performance.
Why build a dashboard for Snowflake?
Snowflake is built specifically for the cloud, and it's designed to address many of the problems found in older hardware-based data warehouses, such as limited scalability, data transformation issues, and delays or failures due to high query volumes.
Here are five ways snowflake visualization can benefit your business.
Performance and speed
The elastic nature of the cloud means if you want to load data faster or run a high volume of queries, you can scale up your virtual warehouse to take advantage of extra compute resources. Afterwards, you can scale down the virtual warehouse and pay for only the time you used.
Storage and support for structured and semistructured data
You can combine structured and less structured data for analysis and upload it to a cloud website without the need to modify or modify a non-static relationship schema first. Snowflake automatically prepares how data is stored and processed.
Concurrency and accessibility
Snowflake faces financial problems with its unique multicluster architecture: Queries from virtual warehouses never address queries from another, and each warehouse can go up or down as needed. Data analysts and data scientists can find what they need, if they need it, without having to wait for other loading and processing tasks to complete.
Seamless data sharing
The Snowflake architecture allows data sharing between Snowflake users. It also allows organizations to share data with any data buyer easily - whether a Snowflake customer or not - with student accounts that can be created directly on the user interface. This functionality allows the provider to create and manage a customer's Snowflake account.
Availability and security
Snowflake is still distributed across all available platforms in which it operates - AWS or Azure - and is designed to work continuously and tolerate partial and network failures with minimal impact on customers. SOC 2 Type II is certified, and additional security levels - such as HIPAA customer PHI data support, and encryption across all network communications - are available.
Top Use Cases for Snowflake dashboard
Popular Snowflake Use cases:
1. RETAIL TRANSACTION ANALYSIS
In the retail environment, transactional data comes in large quantities. But quantity is not the only challenge for data analysis. Data must be kept fresh and up-to-date. Even with well-designed processes, your ETL and refresh can be time and resource constrained.
How snowflake can help address these problems:
Abstraction: Snowflake's processing abstraction with Warehouses allows computing power to scale to meet business needs without changing infrastructure.
Backups: Snowflake Time Travel keeps 90-day backups that are saved periodically, so you can quickly roll back to an older version of your data file (or even "freeze" the table) if something goes wrong.
2. MAKING HEALTHCARE ANALYTICS
Trend research can help healthcare organizations improve patient outcomes by identifying conditions, behaviours, and environmental factors. To conduct this research, organizations need vast amounts of public health data.
Snowflake features that can help address these problems:
Datalake reads: Snowflake can read from the Amazon S3 datalake. Organising disparate data will help organize information and allows to use of the External Tables feature to display data in a structured or semi-structured way.
Data Display: Using the Variant Columns feature, Snowflake allows you to create semi-formatted tables and load all JSON and XML data into the database, object by object. This allows you to create views that are formatted and user-friendly.
3. FUELING MACHINE LEARNING
It would be great to have a crystal ball that could accurately predict changes in the stock market. While we all know that a crystal ball isn't realistic, you may be able to create a smart solution that will help reduce the risk of your choice and improve your chance of being right. To create this type of solution, you should plan to use historical inventory data and business data, reports and legislative data.
Snowflake offers several features that can help address this hypothetical applications needs:
Multi-cluster warehouse: Allocating a large multi-cluster warehouse to your Snowflake team allows you to run multiple high-load queries simultaneously with fast responses.
Monetization: The Snowflake Data Marketplace allows you to monetize the massive and valuable data set you have collected.
How to use DronaHQ to build a Snowflake dashboard
Step 1: Adding the Snowflake integration on DronaHQ

First, go to the panel menu on the left and click on “Connectors”. It will show various connectors of different tools. On the top right corner just on the left of the profile icon, click on “ + Connectors”.
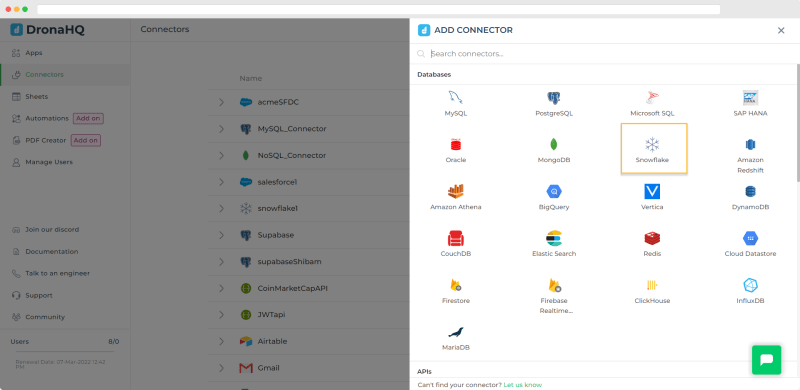
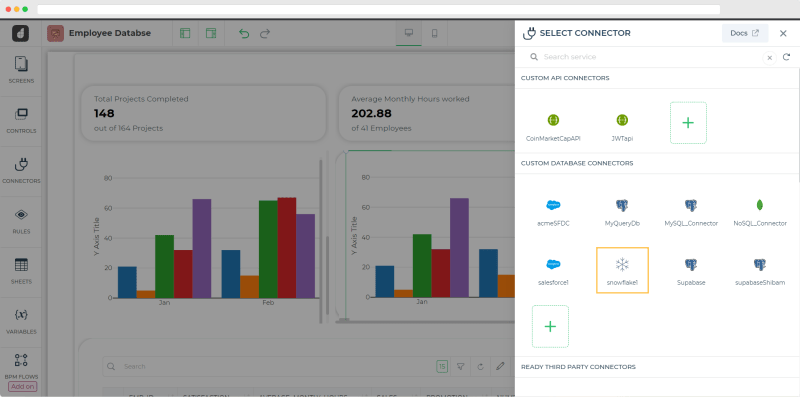
After clicking that button, we will see a list of databases and tools we can integrate with dronaHQ. Click on Snowflake.

After clicking on that button the required information such as the Name of your connector and details regarding the account of Snowflake needs to be filled in so that it can be integrated.
Here is how you can find the account name in Snowflake.
Steps for finding the account name:
- Go to app.snowflake.com and log in using your credentials.
-
On the Omnibox of the browser (where the URL of the page is displayed), you will find a profile menu, click on that.


- The URL is of the form app.snowflake.com/[REGION]/[LOCATOR]. And the account name is of the form [LOCATOR].[REGION]
The rest of the details are pretty straightforward and can be found easily on Snowflake.

After filling in all the details click on “Test Connection” and wait for the ‘Connection is successful!’ message and then “Save” the connector.
Step 2: Adding the dataset to Snowflake Database
-
Go to the Snowflake app and from the left panel click on “Data”.
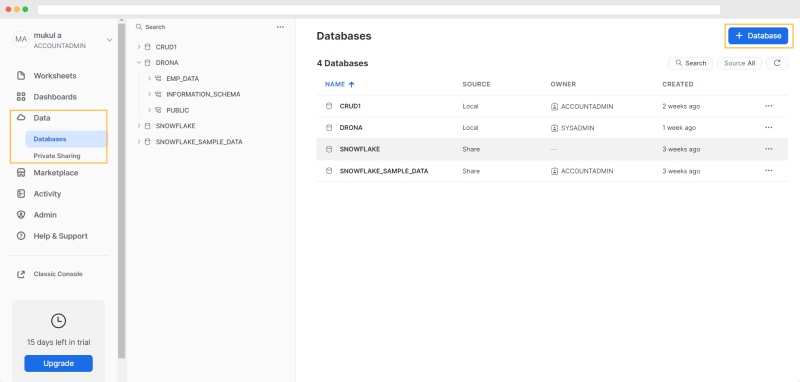
- Now click on “+ Database” in the top right corner and create a new Database.
- After creating the database click on it and make a schema using the button on the top right.

- This will create a new table where you can add the data using worksheets.
Step 3: Building the queries in the Snowflake connector
After connecting with the snowflake connector, add queries to it through the “+ Add Query” Button.

You can add CRUD Queries like add employee, get employee, delete employee, update employee. Here’s an example for reading the data.

After writing the query, click on “Test Query” and if everything works fine then “Save”.
Step 4: Building the UI for Snowflake Dashboard on DronaHQ
1. Create a new Blank App on DronaHQ.
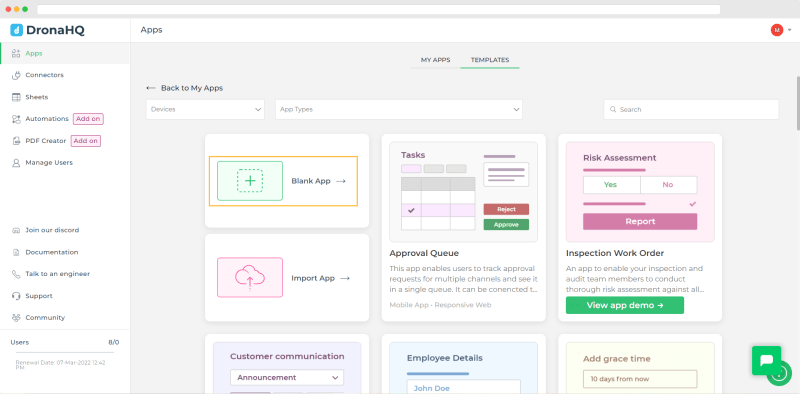
A screen like this will appear
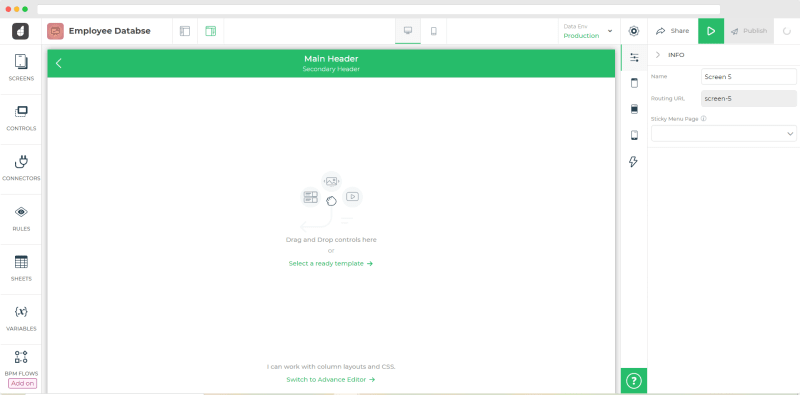
2. Let’s start building our UI, On the left panel, click on “Control”, and a list of various controls will appear

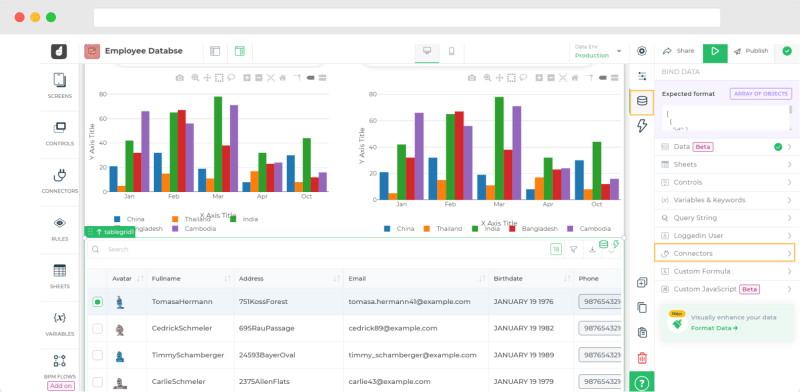
3. Drag and drop 2 dashboard, 1 table grid and 2 chart controls to our screen. After arranging the controls, Your app will look like this:

These UI controls currently display default data. Up next we will bind them to our Snowflake Database.
4. Now we will add data to all the controls.
a. Let’s start with the table grid control (Guide for Table grid control) first, click on the table grid control and then on the data icon on the right panel. After that click on the “Connectors” button, then on “Select Connector” because we need to fetch the data from Snowflake Database.
A list of connectors will appear, from that select the Snowflake connector. Various queries will be displayed that we made at the time of integrating the snowflake connector.
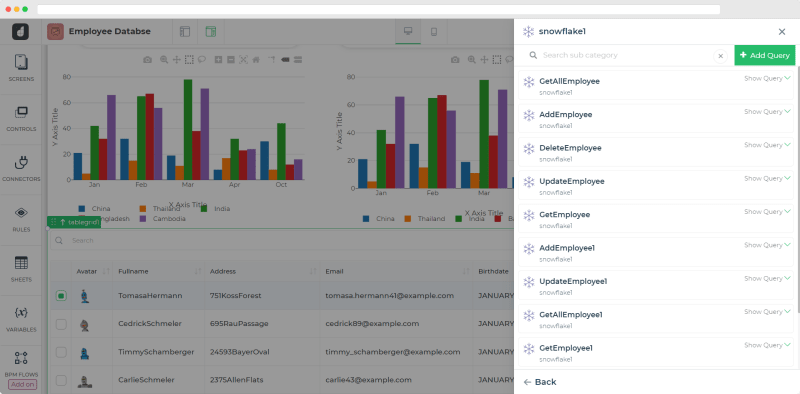
We will select the GetAllEmployee Query to fetch all the data from the table and in the properties of control choose the columns from which you want to show(all columns will be selected by default). This will display the data in the table grid.
You can also use a similar control called Data Store control which allows you to fetch data from the database in one API call (Guide for Data Store Control).
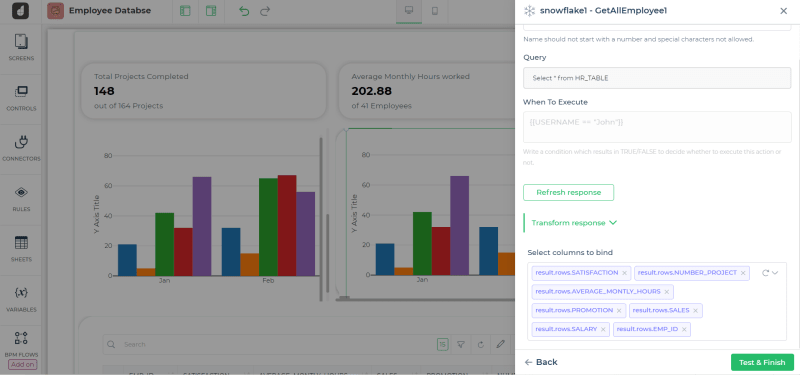
b. Now let’s see for chart controls (Guide for Chart control)
Go to the Data tab of the chart control and click on the connectors option. Then click on the “select connector” button.
A list of connectors will appear, click on your snowflake connector
It will display a list of queries which are there in our connector
We will select GetAllEmployee Query to fetch all the data from the database.
After clicking on GetAllEmployee query it will show environments, click on continue without changing it.
After that, you will see the screen to select which columns to bind, select the columns which you want to use in your charts and click on Test & finish.
Then go to the properties tab of chart control and search for the data section.
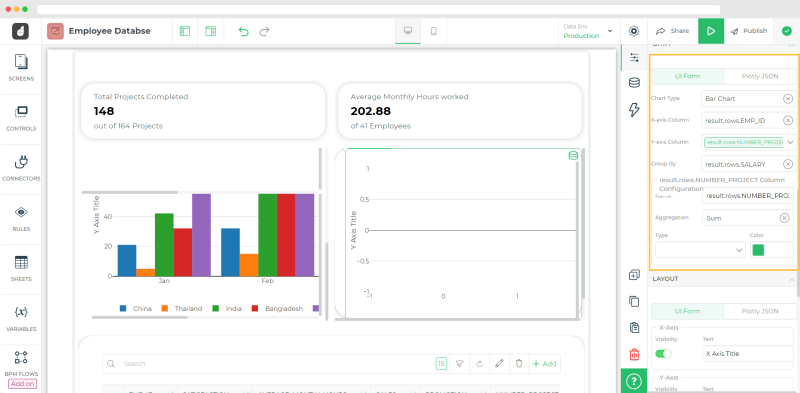
Select the chart type you want to show and the columns for which you want to display data and that's it!
c. Let’s look out for our last control which is dashboard control. (Guide for Dashboard control)
Dashboard control has options to add the data to 5 components, i.e. title text, header, footer, progress and text.

Add data to the component using a connector, the process is the same as that of the chart control. You can use a custom formula with a connector by first adding the data through the connector and then in the custom formula edit the formula as shown below.
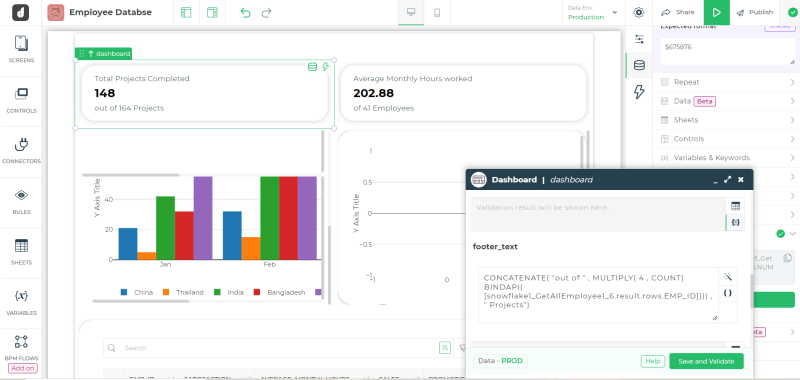
BINDAPI (What is BINDAPI) is the formula which is inherited from the connector you just need to add some functions such as count, multiply etc to make it look good.
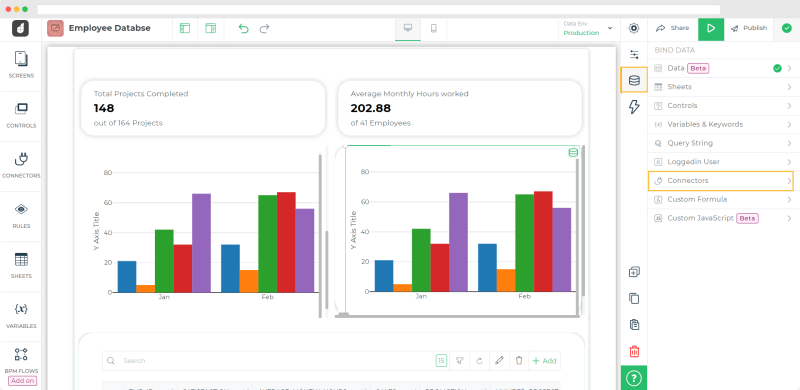
So our final dashboard will look somewhat like this, although it totally depends on how you’re visualizing your data.

Congratulate yourself! Finally making a snowflake dashboard.
Key features of Snowflake dashboards that are built with DronaHQ:
- Integrate database: Integrate with any database with the help of various connectors. DronaHQ supports up to 50+ ready connectors to popular databases like MongoDB, Firebase, Airtable, Influx and lots more. So while you are bringing Snowflake data to the front end, you can also join that data to information from other sources like Google Sheets, MS SQL, or Salesforces. See all connectors here >
- Controls: Dashboard control made data interpretation convenient and easy. The table grid control provides all the CRUD operations for the Snowflake dashboard. Chart control offers various options for visualization that are easy to modify and make data visualizations easy. Not only this you can use form-based control, map control, donut chart controls and many more to make your application interactive. See all controls here >
- Sharing Options: Collaborators can control the permissions of who can access the app and edit the app on the basis of roles. Permissions are an important part of healthy team collaboration: with the right permissions, you can ensure that only certain people are permitted to change the information on your bases.
- Mobile + Web App output: All the micro-apps built on DronaHQ are also available in an employee portal mobile app.
- Unlimited end-users: All plans of DronaHQ can have unlimited users, even with the free developer plan.
Build amazing dashboards with DronaHQ
In this article, we have learned about Snowflake Dashboard and their usage. This article also provided in-depth knowledge about building a snowflake dashboard and its key features, its components, and the steps involved in creating Snowflake Dashboards.
Now build your own dashboard on DronaHQ using any database or app be it a customer order dashboard, inventory dashboard, or salesforce dashboard.
Thank you!

Top comments (0)