
All companies have long-term and short-term plans. Especially, big companies like Walmart must make sure about the effectiveness of future plans. Sales forecasting is one of the very important plans because it gives idea to the company for arranging stocks, calculating revenue and deciding to make new investment. Another advantage of knowing future sales is that achieving predetermined targets from the beginning of the seasons can have a positive effect on stock prices and investors' perceptions. Also, not reaching the projected target could significantly damage stock prices, conversely. And, it will be a big problem especially for Walmart as a big company.
Walmart began recruiting competition for store sales forecasting on Kaggle. As a Module 4 project of Flatiron School Data Science Bootcamp, I worked on this competition. The reason for choosing this project is to learn more about time series models and to learn deeply which parameters effect sales forecasting. My previous work before bootcamp was about sales, so I also would like to observe my seasonal effect experiences scientifically.
The data was obtained from Kaggle. In the data, there are mainly weekly sales of departments and stores, holidays, type and size of stores and some external features such as consumer price index, fuel price, temperature and unemployment rate.
Main Challenge of This Project

The main challenge of this project for me is seasonal sales. Some seasons have higher sales values like Thanksgiving, Black Friday and Christmas. These seasonal effects make the data highly non-stationary. Dealing with non-stationary data is not easy. There are many ways to solve this problem.
- Differencing : We can calculate the difference of consecutive terms in data. Differencing is generally done to get rid of the varying average.
- Seasonal Differencing : The idea behind this technique is taking the difference of same seasons like the difference between 2010 and 2011 for the first week of January.
- Transforming Data: This technique is generally used for non-constant variances. We can transform data with taking log, square root or power transform, mainly. We can also shift the data.
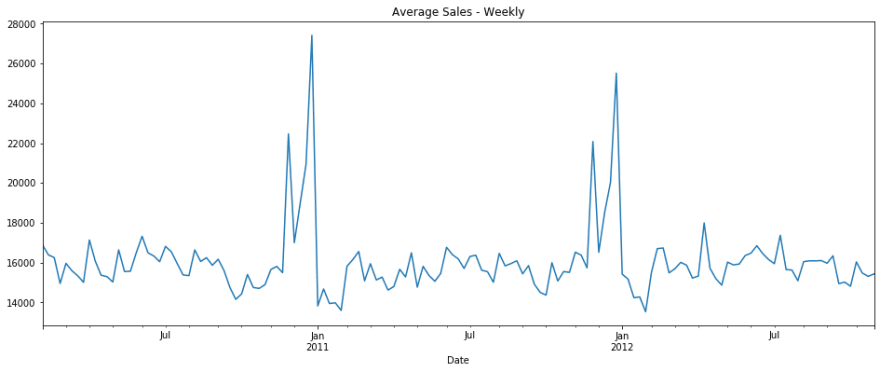
The best solution which I found for making my data more stationary is that I took differences of consecutive terms and used this more stationary data for modeling. From the below graph, it can be seen easily how my data is non-stationary. I improves this also with Adfuller test. Details about Adfuller test can be found here.
Metric and Models
The metric of the competition is weighted mean absolute error (WMAE). Weight of the error changes when it is holiday. It calculates the error of holidays 5 times more than normal days such as if I predict 50$ wrongly for usual days, it means 250$ error for holiday predictions. I think, Walmart wants to give weight for true holiday predictions because holiday sales are more higher and important than usual times. Details of metric can be found in this link.
After trying some machine learning and time series models, I found best results with Exponential Smoothing(Holt-Winters) which flattens the trend of data. My best error value is 821. If we assume our weekly sales averages between 18000-20000 dollars, it means my model can predict future sales of Walmart stores with 4% error.
Explorations
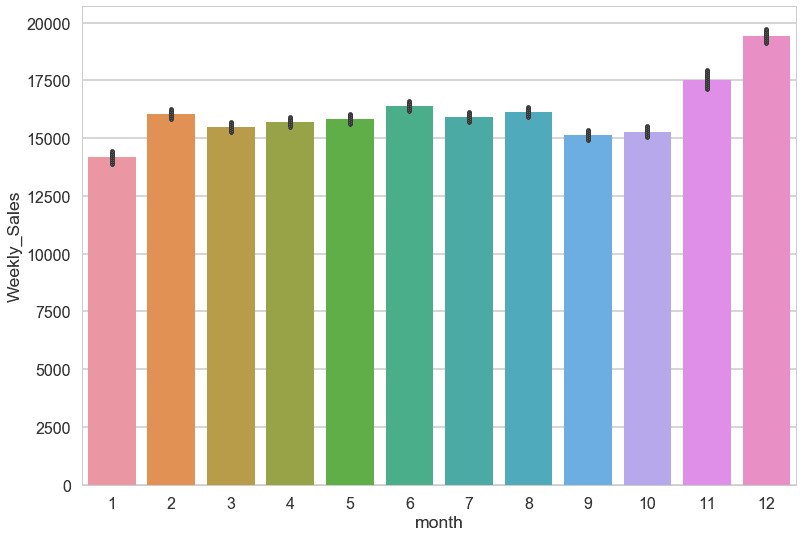
- When we look at the average sales monthly, it is obviously seen that November and December have higher sales. To make deep analysis, I looked at the weekly sales with corresponding week numbers.
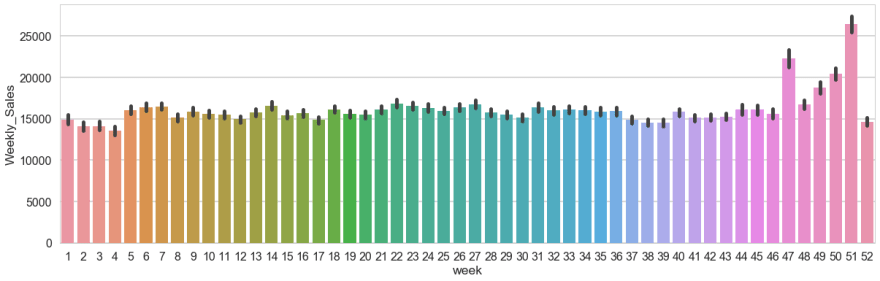
From the graph, we can understand easily 51st and 47th weeks have higher sales. It means that higher demands in whole year belong to Christmas, Thanksgiving and Black Friday seasons. 50th and 49th weeks are following top 2. And, it is not obviously seen from the graph but I found it from values in project that 22nd week is in the top 5. It means that after schools are closed at the end of the May, people prefer to shop for summer or holiday.
Another interesting exploration is that when I looked at the top highest sales, I found it in Thanksgiving time. But, when we look at the graph above, Christmas has higher averages. It means that, maybe Thanksgiving week has higher values individually for some stores and some departments but when we take the average and sort them, Christmas is the best for general average weekly sales.
Although during other months sales are closed to each others, January has the least sales average. This is the result of November and December high sales. After two high sales month, people prefer to pay less on January.

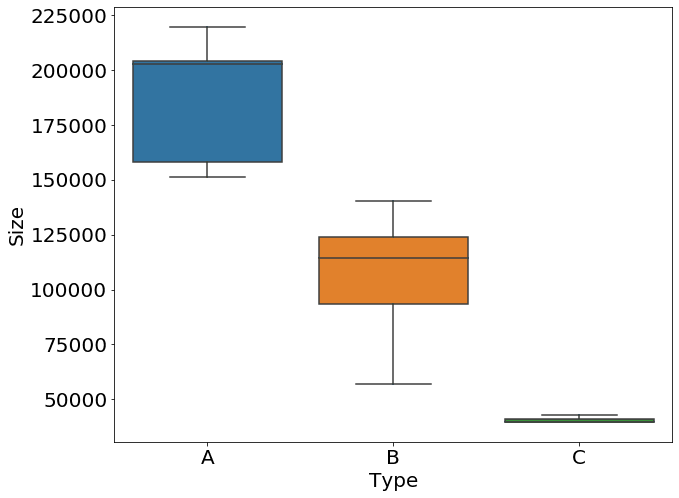
- From pie plot and box plot above, we can understand that there are mainly 3 types of Walmart stores in the data and Walmart categorized them according to sizes. Type A is the biggest store, B is medium and C is the smallest. And, nearly half of the stores in the data are Type A stores which are biggest.
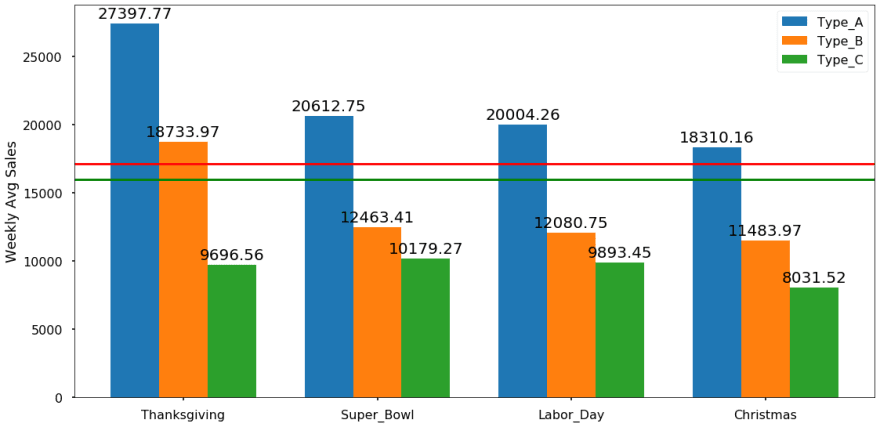
- In the graph above, red line shows the average holiday sales and green line represents the average non-holiday sales. According to lines, holiday average is higher than non-holiday, as expected.
- It is obviously seen from the graph that size of the store is directly proportional to weekly sales. Bigger stores have higher average sales.
And, it is interesting that according to this graph, Thanksgiving sales are shown higher than Christmas but we know from the weekly graph, 51th week is the best. When I looked deeper to the data, I realized that Walmart assigned Christmas sales to the 31-Dec-10, 30-Dec-11, 28-Dec-12, 27-Dec-13. But we know that people generally do their Christmas shopping before last week of the year. So, it is not a good idea to assign Christmas sale season to the last week of the year. The problem in the data can be understood easily from this graph.
Interestingly, according to this data consumer price index, temperature, fuel price and unemployment rate do not have any pattern on weekly sales.

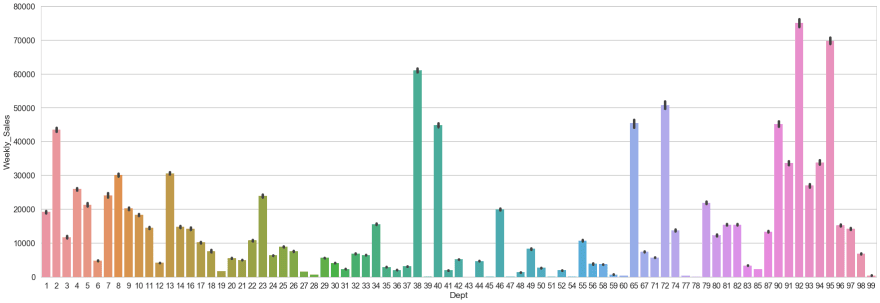
- The first graph above shows that department 72 has some higher values, when I looked at the numerical data also I understood that especially on Thanksgiving department 72 has high sales. But, from the second graph above, I found some other department with higher average sales. It shows that, although department 72 has good sales during Thanksgiving, some other departments such as 92 or 95 have higher sales averages in general. This graph shows us one more time the importance of seasonal sales and misleading points of seasonal sales.
Future Improvement and Recommendations
- As a modeling perspective, data will be made more stationary with different techniques, feature selection and feature engineering can be added to model also.
- As a data quality perspective, to improve to results, more data is needed, which has more detailed seasonal sales such as Come Back to School, 4th of July, Memorial Day, Halloween or Easter. Before these holidays, some department can sell more products.
- There are markdowns and store sales for some special seasons. The effect of markdowns and discounts on departments can be added to the model.
- From the data, I observed that some holidays has higher effect of some stores and some departments. So, different models can be build for each store and departments. It is not easy to build model for 45 different stores and 81 different departments but it can be begun with the departments and stores which have higher sales. Because, they have higher effect on total sales than others.
- And lastly, market basket analysis can be added to the data, to find higher demand items of departments.
All details for cleaning process, data preprocessing, modeling process, more explorations and solutions for problem and future improvements can be found in this github repo.
Cover image by PublicDomainPictures from Pixabay and gif is from giphy

Top comments (0)