
Important Note: This tutorial focuses on Odoo development using the source code folder, as opposed to the Docker approach.
Prerequisites:
- Install PyCharm.
- Place the Odoo source code folder.
Open the PyCharm application either from the UI or command line. Once PyCharm is launched, navigate to the Main Menu items > Run > Edit Configurations. This action might open a window as depicted below. If not, simply click the + button, and a new default dialogue window will appear.

In the default new configuration, the script parameter box may not be visible. Click on the "modify options" and select "parameters."

Once all the required values are entered, close the window. A debug icon will appear on the top side of the window, as shown in the screenshot (the green bug).

Next, set a breakpoint in your code and run Odoo with the debugger. It will hit the breakpoint, and the debugger console will be displayed. Python code can be executed in the debug console to check any expressions.
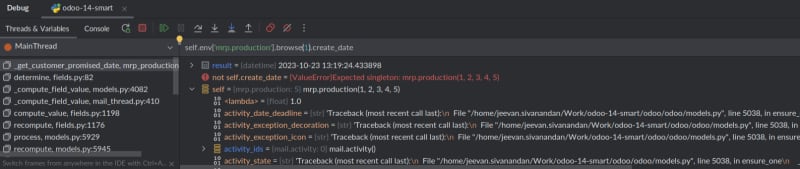
Once in the debugger console, you can use the following code to gather more information about the model and related components:
self.env['sale.order'].search([])
self.env.context
The first line (self.env['sale.order'].search([])) allows you to search for any model file, where 'sale.order' represents the model file in this example. The second line (self.env.context) provides information about the current window/page in the Odoo UI.

Top comments (0)