
This is a beginner's tutorial (by example) on how to analyse text data in python, using a small and simple data set of dummy tweets and well-commented code. It will show you how to write code that will:
- import a csv file of tweets
- find tweets that contain certain things such as hashtags and URLs
- create a wordcloud
- clean the text data using regular expressions ("RegEx")
- show you what tokenisation is and how to do it
- explain what stopwords are and how to remove them
- create a chart showing the most frequent words in the tweets, and their frequencies
The Jupyter Notebook is available on GitHub here.
The code uses pandas dataframes so if you're unfamiliar with those then this tutorial may help.
First, import the libraries and set the relevant configurations:
import numpy as np   # an essential python module
import pandas as pd   # for importing & transforming data
import re   # for regular expressions
import matplotlib.pyplot as plt   # for wordclouds & charts
import seaborn as sns   # for charts
sns.set_style("whitegrid");   # chart background style
plt.rcParams['figure.dpi'] = 360   # for high res chart output
from wordcloud import WordCloud   # for the wordcloud :)
import spacy   # for tokenising text
from spacy.lang.en import English  # for tokenising text
nlp = English()   # for tokenising text
from collections import Counter   # for getting freq of words
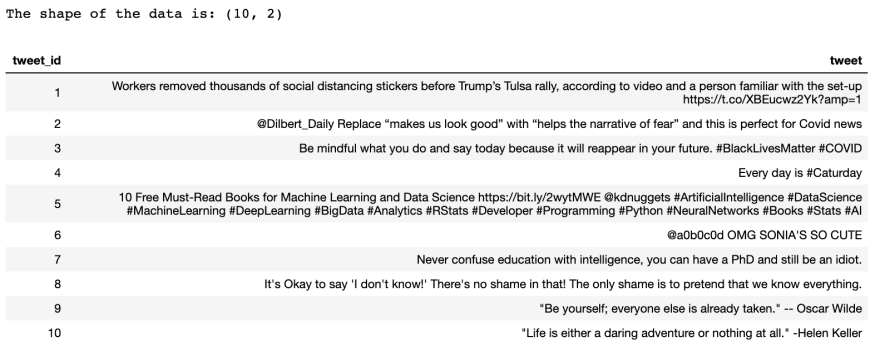
Then, let's import a csv file containing 2 columns (tweet_id and tweet) and 10 rows. I created this csv by just copy-pasting a few tweets from Twitter into an Excel file and saved it as a csv file.
# import the csv file into a Pandas dataframe
tweet_df = pd.read_csv("tweet_sample.csv")

# view the shape of the data (the number of rows and columns)
print(f"The shape of the data is: {tweet_df.shape}")

# view the data with the "tweet" column widened to 800px
# so that the full tweet is displayed,
# and hide the index column
tweet_df\
.style.set_properties(subset=['tweet'], **{'width': '800px'})\
.hide_index()
My output looks like this:
(Note: If you're new to f strings, i.e. the print(f"...{}") bit in the code above, then this tutorial may help)
Now let's find all the tweets that contain a hashtag.
# let's find out how many tweets contain a hashtag
tweets_with_hashtags = tweet_df.loc[tweet_df["tweet"].str.contains("#")]

# view the number of tweets that contain a hashtag
print(f"Number of tweets containing hashtags: {len(tweets_with_hashtags)}")

# view the tweets that contain a hashtag
tweets_with_hashtags\
.style.set_properties(subset=['tweet'], **{'width': '800px'}).hide_index()
My output:

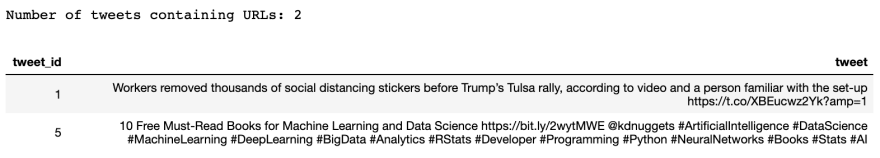
How many contain a URL?
# how many tweets contain a URL i.e. "http"?
tweets_with_URLs = tweet_df.loc[tweet_df["tweet"].str.contains("http")]

# view the number of tweets that contain a URL
print(f"Number of tweets containing URLs: {len(tweets_with_URLs)}")

# view the tweets that contain a URL
tweets_with_URLs\
.style.set_properties(subset=['tweet'], **{'width': '800px'}).hide_index()
My output:
Let's create a wordcloud. Before we can do that, we need to create one long string containing all the tweets.
# create a single string containing all the tweets,
# as this will be needed to be able to create a wordcloud
tweet_string = " ".join(tweet for tweet in tweet_df["tweet"])

# view the first 200 elements of the string to check
# this worked as expected
tweet_string[0:200]
My output:
![]()
Now we can create the wordcloud using this long string, and then view it. We'll only view the top 100 words so max_words will be set to 100.
# create the wordcloud
tweet_wordcloud = WordCloud(background_color="white",
                              max_words=100,
                             ).generate(tweet_string)

# view the wordcloud
plt.imshow(tweet_wordcloud, interpolation='bilinear')
plt.axis('off')
plt.show()
My output:

Let's clean up the data using the re python library to use regular expressions ("RegEx"). There is a useful guide on RegEx in Python here.
First, let's replace mentions (e.g. @Dilbert_Daily) with '@USER'.
# replace all the mentions (e.g. @Dilbert_Daily)
# from the tweets with '@USER'
tweet_string = re.sub(r'@\w+','@USER ', tweet_string)

# view the first 200 elements of the string to check
# this worked as expected
tweet_string[0:200]
My output:
![]()
...then replace all URLS with '_URL'
# replace all the URLs with '_URL_'
tweet_string = re.sub(r'http\S+','_URL_ ', tweet_string)

# view the first 200 elements of the string to check
# this worked as expected
tweet_string[0:200]
My output:
![]()
...then convert the text to lower case so, for example, instead of having "Be" and "be" included as 2 separate words, we only have "be":
# convert the text to lower case so, for example, instead
# of having "Be" and "be" included
# as 2 separate words, we'd only have "be"
tweet_string = tweet_string.lower()

# view the first 200 elements of the string to check
# this worked as expected
tweet_string[0:200]
My output:
![]()
Let's remove the extra spaces so there's only one space between words:
# remove extra white spaces so there is only one
# space between words
tweet_string = re.sub(r'\s+',' ', tweet_string)

# view the first 200 elements of the string to
# check this worked as expected
tweet_string[0:200]
My output:
![]()
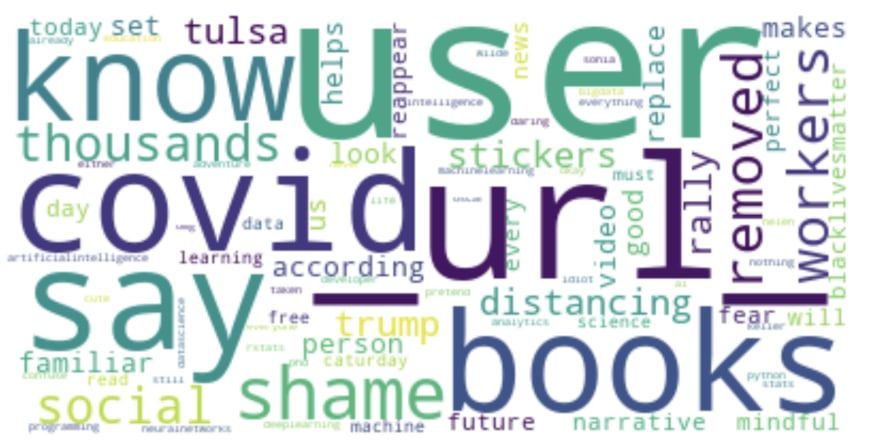
Let's view the wordcloud for this cleaned-up string:
# create the wordcloud
tweet_wordcloud = WordCloud(background_color="white",
                              max_words=100,
                             ).generate(tweet_string)

# view the wordcloud
plt.imshow(tweet_wordcloud, interpolation='bilinear')
plt.axis('off')
plt.show()
![]()
Let's change it so that the wordcloud only shows the top 25 words:
# create the wordcloud
tweet_wordcloud = WordCloud(background_color="white",
                              max_words=25,
                             ).generate(tweet_string)

# view the wordcloud
plt.imshow(tweet_wordcloud, interpolation='bilinear')
plt.axis('off')
plt.show()
Next, let's tokenise the string i.e. split the string into separate tokens (i.e. separate elements in a collection) using spacy. In this example, each token will be a word. This isn't the only option used in NLP. We could choose tokens to be individual characters, parts of words, 2 words (known as 2-grams/bi-grams), 3 words (3-grams/tri-grams), 4 words (4-grams), sentences... But for this example each token will be a word.
# create a spacy document by pointing spacy to the
# tweet string
tweet_doc = nlp(tweet_string)

# get all tokens that aren't punctuation
tweet_words = [token.text for token in tweet_doc if token.is_punct != True]

# get the frequency of each word (token) in the tweet string
tweet_word_freq = Counter(tweet_words)

# get the 5 most frequent words
five_most_common_words = tweet_word_freq.most_common(5)

# view the 5 most common words
five_most_common_words
My output:
![]()
Now let's create a Pandas dataframe containing all the tokens (words) and the frequency of each word, so that we can use this to create a chart.
# create a Pandas dataframe containing the tokens
# (words) and their frequencies
freq_df = pd.DataFrame.from_dict(tweet_word_freq, orient='index').reset_index()

# rename the columns to "word" and "freq"
freq_df.columns=["word", "freq"]

# sort the dataframe so that the most frequent word is
# at the top and view the first 3 rows
freq_df.sort_values(by="freq", ascending=False).head(3)
My output:

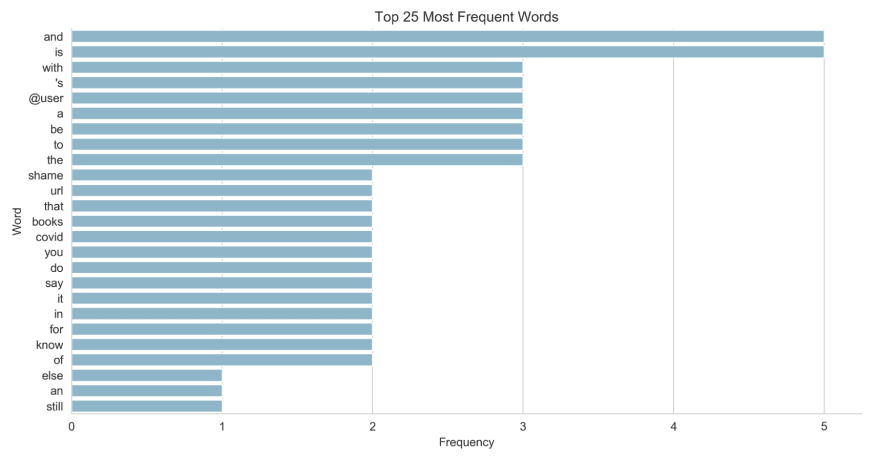
Display a bar chart (using seaborn - which we aliased as sns) of the top 25 most frequent words, and their frequencies:
# display a bar chart showing the top 25 words
# and their frequencies
fig, ax = plt.subplots(figsize=(12,6))
sns.barplot(data=freq_df.sort_values(by="freq", ascending=False).head(25),
            y="word",
            x="freq",
            color='#7bbcd5')
plt.ylabel("Word")
plt.xlabel("Frequency")
plt.title("Top 25 Most Frequent Words")
sns.despine();
My output:
(Note: if you're new to creating charts in Python using seaborn then you may find this post useful)
Next, let's remove words that are really common but not very useful for understanding the topics being discussed, such as 'and'. In the NLP world these are called 'stopwords'. They can be removed easily using the spacy tokeniser's is_stop attribute:
# get all tokens that aren't punctuation
# and aren't stopwords
tweet_words = [token.text for token in tweet_doc if token.is_punct != True and \
token.is_stop != True]

# get the frequency of each word (token) in the tweet string
tweet_word_freq = Counter(tweet_words)

# re-create the Pandas dataframe containing the
# tokens (words) and their frequencies
freq_df = pd.DataFrame.from_dict(tweet_word_freq, orient='index').reset_index()

# rename the columns to "word" and "freq"
freq_df.columns=["word", "freq"]

# display a bar chart showing the top 25 words and their
# frequencies (which will exclude the stopwords this time)
fig, ax = plt.subplots(figsize=(12,6))
sns.barplot(data=freq_df.sort_values(by="freq", ascending=False).head(25),
            y="word",
            x="freq",
            color='#7bbcd5')
plt.ylabel("Word")
plt.xlabel("Frequency")
plt.title("Top 25 Most Frequent Words (Excluding Stopwords)")
plt.xticks([0,1,2,3])
sns.despine();
My output:
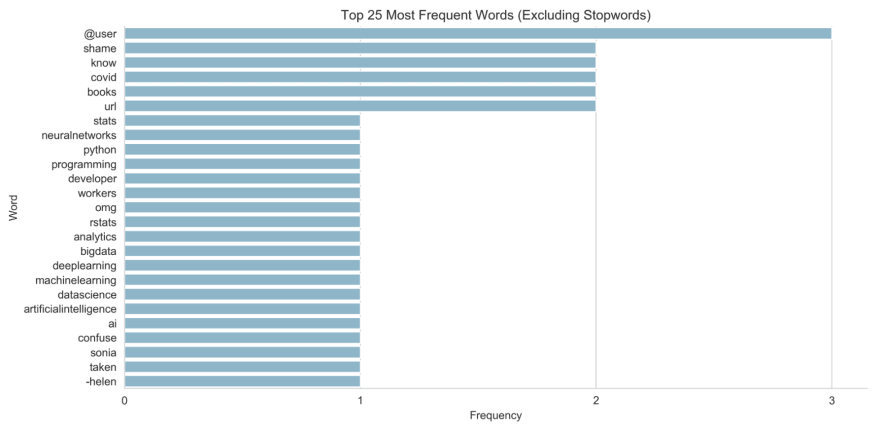
The chart now gives us a much better indication of the topics being discussed in the tweet text.
There's lots more you can do of course, for example:
- how many tokens (words) are in the longest tweet?
- how many are in the shortest?
- what's the mean average number of tokens? (Answers to these length questions are useful later on if you're going to use machine learning models)
- are there any empty documents (tweets)? Our dataset is so small that we can see that there aren't any empty tweets but in real data sets that are larger you'd need to find out programmatically
...but that's probably enough for now. Data cleaning and analysis is a big part of working with text data, and deciding what to change, and how, will depend on the problem being solved and is part of the art of data science. For example, should mentions (e.g. @Dilbert_Daily) be removed/replaced or are they a useful predictor? Will removing punctuation improve or reduce a machine learning model's performance or make no difference at all? Should the text be converted to lower case? There's no right answer, so its useful to be able to easily play around with the text data and experiment.
I recommend playing around with your own dummy data, trying different regular expressions with the re module, and playing around with the wordcloud, spacy and seaborn modules. There's a great tutorial for spacy on their website.

Latest comments (0)