[Cover Photo by Nathan Dumlao on Unsplash]
This project was developed by me and two of my colleagues Angelo and Lorenzo as final project for the course "System Programming" at Politecnico di Torino.
We used the Github Student Developer pack to use the private repositories offered by Github: at that time they where not part of the free tier.
In this post, I want to present an outline of the project which is now publicly available on Github.
 pieromacaluso
/
RoomMonitor
pieromacaluso
/
RoomMonitor
Counting People in a room using WiFi devices
Counting people using Wi-Fi devices
Indice
- Indice
- Team di sviluppo
- Codice sorgente progetti
- Introduction
- ESP32 Firmware
- RoomMonitor Server
- Sviluppi Futuri
- Contibutions and License
- Riferimenti
Team di sviluppo
-
 Piero Macaluso - pieromacaluso
-
 Lorenzo Manicone - lorenzomanicone
-
 Angelo Turco - angeloturco


Codice sorgente progetti
Questo progetto è stato sviluppato partendo dalla proposta di progetto fornita dal prof. Giovanni Malnati durante il corso "Programmazione di Sistema" nell' a.a. 2017/2018.
Introduction
Scansione Attiva
Ogni dispositivo WiFi, in particolare gli smartphone, possiedono la capacità di riconnettersi rapidamente ad una rete WiFi precedentemente associata non appena si vengono a trovare all'interno dell'area di copertura. Questa funzionalità è possibile grazie…
Without further ado, let's start with this presentation.
Table of Contents
Introduction
Active Scan
Each WiFi device, in particular smartphones, has the ability to quickly reconnect to a previously associated WiFi network as soon as they find themselves within the coverage area. This functionality is possible thanks to the exploitation of the active scanning of our devices: these send, at regular intervals, broadcast packets of the PROBE REQUEST type, indicating in an optional manner the SSID for which the connection is made.
ESP32 Device
In this project we decided to exploit the functionalities offered by the ESP32 device. It has an implementation of the WiFi stack, which allows it to record a callback to be invoked every time a CONTROL type packet is received, detecting both BEACON and PROBE REQUEST.
Within this packet, you can find the received signal strength signal indicator (RSSI). In ideal conditions this value decreases exponentially with increasing distance and is expressed in dB. Typical values range between -35 / -40dB (very close), down to -95 / -105dB (very far).
In reality there are numerous factors that can condition this value such as the presence of multiple reflections due to the ground, walls and other obstacles, propagation or interference with other signals present in the environment.
In any case, it remains a useful tool for measuring the distance of the device.
Goal of the project
The main objective of the software we implemented is to provide a system capable of monitoring the number and position of students within a classroom. This is possible by exploiting the PROBE REQUEST packets used by the devices we normally use: these are captured by a series of ESP32 cards (2 or more) and then transmitted to a server which is responsible for filtering and aggregating the packets received from all the boards in action in order to obtain information on the position starting from the values of the RSSI. These values can be converted to a distance value for each device/smartphone (identified by its MAC) and from each board. This process is crucial to triangulate its position.
Project Stack
The implementation of the project was divided into 2 parts:
- The implementation of the firmware to make the ESP32 fleet work. We decided to program these devices by using C.
- The implementation of an application written in C++ using Qt Framework and a MariaDB database to aggregate and manipulate data.
These two parts communicate with each other by using periodical TCP connection to exchange data and synchronize the clock.
ESP Firmware
The purpose of the ESP32 board is to sniff the various PROBE REQUEST packets generated by nearby devices and forward them to the server which will handle them.
Configuration for the user
When assembling the system, an operator is required to initialize the correct values necessary for operation. To ensure easy configuration for each board, a captive portal has been implemented where it is possible to introduce the necessary values without having to change the firmware. To connect to this portal you need to connect to the Wi-Fi network of the board you want to configure (default SSID: esp32-ap, Password:progettoopds), after which, through a browser, connect to the address https://192.168.1.1. At this point the configuration page of the board will be shown where you can initialize all the necessary parameters as shown in this
 |
As you can see, you can change WiFi network settings of the board, assign it an ID (important for server configuration), and the channel on which you want to scan. In the part below you can set all the parameters for communication with the server. The sending of these parameters is made secure through the HTTPS protocol, guaranteeing confidentiality, integrity and authentication, instead for the forwarding of sniffed packets to the server through the TCP channel, the authentication and integrity properties are guaranteed through the use of HMAC-SHA256 with 256 bit key for each packet forwarded. |
Operation
Once configured, the board will connect to the WiFi network of the server. It is important that this network has an internet connection as the card will use this connection to receive the correct time via an SNTP server. Only after acquiring the correct time, the sniffing and forwarding procedure will start. During the sniffing phase, all the various PROBE REQUESTs transmitted on the channel indicated in the configuration phase will be captured. The necessary information will be extracted from these packets and, only when the sniffing phase is complete, all the acquired data will be sent to the server and then the board will resume the first phase. Thanks to the use of a timer every minute, the sniffing and forwarding phase is alternated. To ensure correct synchronism between the various boards and the server, the same timer also indicates when to update the time by making a further request to the SNTP server.
RoomMonitor Server
This second component of the project represents the desktop application for receiving, manipulating and storing the data received from the analyzes of the various ESP32 boards. This performs real-time monitoring functions, but also analysis functions of past data.
Settings
Room
The room settings allow you to enter data on the characteristics of the room where you will be monitoring.
- Room Width and Length: these values are useful for drawing the perimeter of the room on the screen and for discarding data that is not inside the room.
- Boards: it is possible to insert the cards that are positioned inside the room by indicating the unique ID of the card, position and power at one meter (dBm).
Monitoring
- Constant Signal Propagation: parameter used by the algorithm to switch from RSSI to distance in meters. This parameter is set by default to 2 or 3 for spaces such as classrooms or rooms.
- Minimum minutes for presence counting: the granularity with which the estimates are made is 5 minutes. This parameter indicates how many minutes out of the total of 5 are required for the software to count the person as present in those 5 minutes.
- Aggregation Failure Limit: this parameter indicates what is the maximum number of aggregations that the software will do without receiving even a single packet from at least one coupon
- TCP Server Port: used to specify in which port the TCP server will receive data from the various coupons.
Database
In this window you can go to specify all the data concerning the database in which to save the aggregated data received from all the boards. From this facade it is possible to go to work on the database by initializing a new table for a new capture or by restoring the configuration of the coupons for a given room.
MAC Hidden
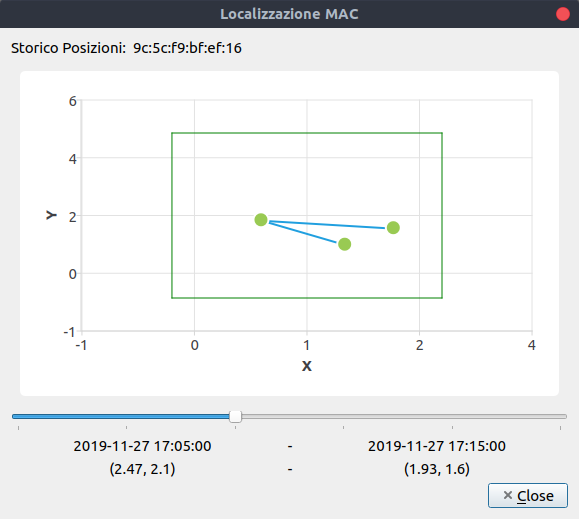
In this screen you can go to set the tolerances and weights for each parameter to be taken into consideration in estimating the similarity of the hidden MAC. It is possible to specify the tolerance for the position, the time and the SSID. The weights represent how important that parameter will be in calculating the estimate. The calculation of the estimate is done using the following equation where p represents a number between 0 and 1, where 1 indicates that the time/space difference between two packets is equal to 0 or that the SSID is identical. Zero indicates a difference greater than or equal to the tolerance or different SSID.
The percentages thus calculated for each packet are then averaged on the number of packets referring to the same MAC pair in order to give an estimate of similarity between the two MAC addresses.
Monitoring
| Attendances | MAC Frequency | Slider MAP |
|---|---|---|
 |
 |
 |
| MAC Localization | Random MAC estimate |
|---|---|
 |
 |
The main part of the software consists of the monitoring phase where the server listens for the TCP connection coming from the configured tickets from which it receives the data to make the estimates.
Aggregation
In terms of timing, we have decided to implement the system so that it is able to operate asynchronously, leaving a layer of decoupling between the tickets and the aggregation server.
The boards are free to send the packets on a regular basis for one minute to the server by queuing in the TCP channel. The data thus received is accumulated in a single second-chance packet queue. Every minute the server will perform the aggregation on every single packet: this (identified by the 32bit CRC transmitted by the board) will be saved on the database and eliminated from the queue only if there is a number of packets equal to the number of boards used.
Otherwise, the chance counter will be increased for every single package. At the end of each aggregation process, the counters of each package are checked to see if the package should be deleted or maintained.
This approach allowed to manage the packets received from all the boards without introducing forcing by synchronous mechanisms.
Trilateration
When for each package (identified by the 32 bit CRC) data from all the boards configured in the capture are available, then it is time to go to calculate the estimated position of the package and save it in the database.
For the calculation of the position in space we decided to use trilateration. This requires, first of all, to convert RSSI values to meters. This procedure was possible thanks to the following formula:

A represents the signal strength of the card when the device is one meter from it, while n is the signal propagation constant which in open spaces or very large classrooms is usually equal to 2 or 3 (in our analyzes we used the 3).
Once the distance measurements have been obtained, we have in fact obtained as many circles as the number of boards: their position represents the center of the circle, while the distance is the radius.
From these data it is possible to estimate the position of the device.
Initially we thought of enlarging or decreasing in equal measure all the available circles (increasing or decreasing the RSSI) in order to have a common area for everyone in which to go to estimate the position of the device through the intersection points. This approach proved to be not very functional and unstable: in some cases it would end up in situations where circles were unable to increase or decrease consistently and the algorithm (designed to continue making finite attempts) concluded the analysis by discarding the package.
After carrying out a research on the various methods to estimate the position, we decided to proceed with a method similar to the previous one, but which manages to be more stable with due simplifications.
In order to estimate the position, combinations of circles are taken and their intersection is calculated by increasing the radius to ensure that there is at least one point of intersection: in the case of two points of intersection, the one closest to the centers of other circles is taken. Once these points have been accumulated, the weighted average is calculated, based on the radius of the circumferences used for the calculation of that specific measurement.

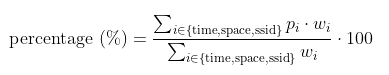
Analysis
Long Term Statistics
Once the data is acquired, it is very useful to have an interface with which to go to consult and analyze it. This is the goal that the analysis part of the application has set itself.
In this section it is possible to select a range of dates in order to obtain data on this period of time with a granularity of 5 minutes.
As an architectural choice we decided to manually limit this period of time to one month, a period that seemed to us a reasonable compromise between usability and performance (always counting the fact that a granularity of 5 minutes over a month is still very complex to manage).
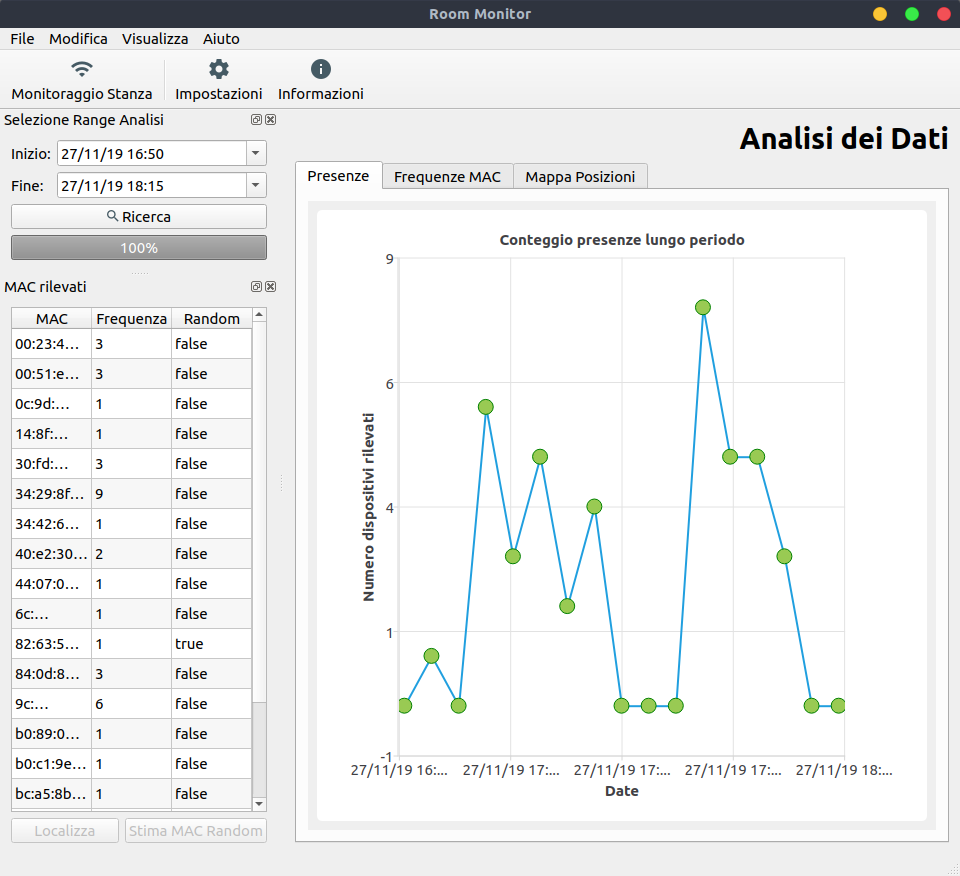
The user can view the progress of the presences within the first graph as a function of time, view the devices that have been detected most frequently and a graph with the situation of the animated positions with granularity of 5 minutes in 5 minutes.
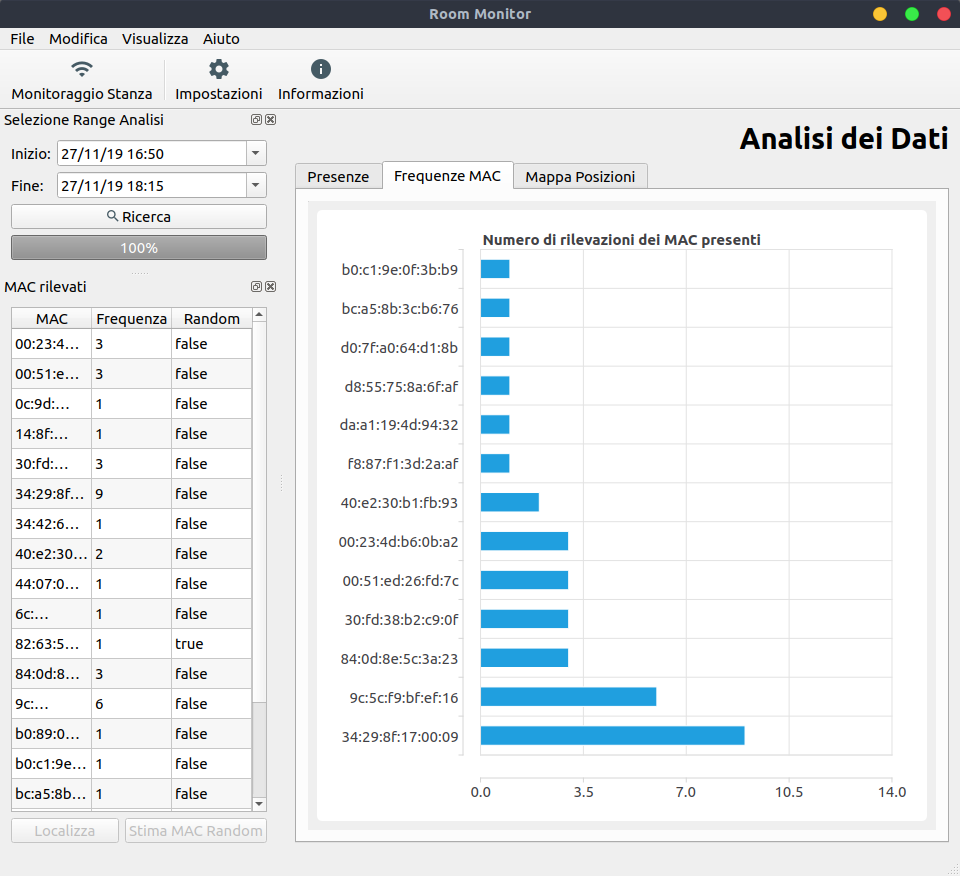
Movement View
The user can also go to choose a MAC of a device from the list on the left and can go to analyze its movement through an animation regulated by a slider.
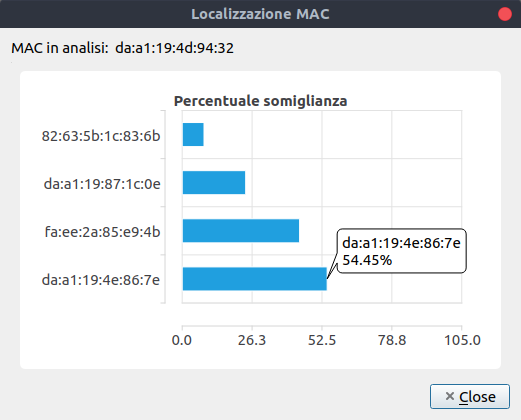
Hidden MAC analysis
By now most of the devices with the most updated operating systems have the functionality of the hidden MAC: the device card generates a random MAC every few seconds. This feature allows you to not be traceable, while maintaining privacy.
Assuming that making such an analysis based solely on location, time and SSID is very far from being precise, this can in any case give a rough view of what could be the devices that most approach to that under analysis.
Conclusions
The software we implemented was stable and capable of functioning for a very long time. Despite this fact the estimates about the position of the devices in the room where not so precise. However, this is not a problem directly related to the implementation of the software and the algorithm inside the program. It is mainly related to the fact that RSSI is an estimated value, thus prone to errors: it also depends on the type and quality of the WiFi board of the device monitored.
Despite these facts, this software can be a good tool have an high level estimate about the occupance of a specific room.
This can be also useful for the particular historical moment we are living today with the problems caused by of COVID-19. It could be useful to track the presence of people inside a room.
References
- [1] Zhang, Chuan Wei, and Xin Zhao. "The wireless sensor network (WSN) triangle centroid localization algorithm based on RSSI." MATEC Web of Conferences. Vol. 63. EDP Sciences, 2016.
- [2] Gamba, Paolo, Dott Ing Emanuele Goldoni, and Marco Risi. "Confronto di tecniche di localizzazione per le WSN basate su RSSI."
- [3] Luca Pappalardo. "Localizzazione: Problema, Tecniche, Algoritmi". Dipartimento di Informatica - Università di Pisa. Reti mobili: Ad Hoc e di sensori, 2011.

Top comments (0)