
TL;DR: UML activity diagrams are essential for modeling workflows and system logic. This guide walks developers through building interactive UML diagrams in Vue using reusable components, symbol palettes, and connectors, perfect for visualizing business processes and decision flows.
UML activity diagrams are an excellent tool for visually representing a system’s flow of control or data. From modeling complex business processes to defining workflows, UML activity diagrams make it easy to analyze and design systems more effectively.
In this article, we’ll explore how to create interactive UML activity diagrams using the Syncfusion Vue Diagram Library
What is a UML activity diagram?
A UML activity diagram visually represents the sequence in which actions occur within a system. It helps illustrate the flow of control or data among activities.
Key elements include:
- Activity nodes: Represent individual tasks or actions.
- Control flows: Arrows that show the transition between activities.
- Decision nodes: Diamond-shaped elements that indicate branching paths based on conditions.
- Start and end nodes: Symbols marking the beginning and end of a process.
UML activity diagram notations and their meanings
| Shape | Image | Description |
| Action |  |
A specific task or action in the workflow. |
| Decision |  |
A decision point where multiple paths can be taken based on conditions. |
| MergeNode |  |
Combines multiple incoming flows into a single one |
| InitialNode |  |
Starting point of the activity |
| FinalNode |  |
End of the activity flow |
| ForkNode | Splits a one flow into multiple concurrent flows | |
| JoinNode | Synchronizes multiple concurrent flows into a single flow | |
| TimeEvent | 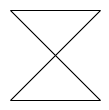 |
Represents a delay or timed trigger in the activity |
| AcceptingEvent | 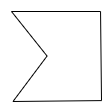 |
Waits for a specific signal or condition. |
| SendSignal | 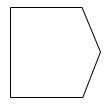 |
Represents sending a signal |
| ReceiveSignal | 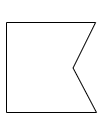 |
Represents receiving a signal |
| StructuredNode |  |
A group of actions executed as a single unit or block |
| Note |  |
A comment or additional information |
| Object/ Control |  |
A connector object representing a relationship with UML activity nodes |
| Exception |  |
A connector object representing a relationship Exception with UML activity nodes |
Prerequisites
Ensure you have Node.js installed, recommended version: 14.15.1, 14.17.3, or 18.20.0 and later.
Creating a diagram surface
Let’s create a diagram surface by following these steps.
Step 1: Create a folder named UML Activity Diagram.
Step 2: Open your terminal and install the Vue CLI globally using the following command:
npm install -g @vue/cli
Step 3: Create a new Vue app using the following command.
vue create uml-activity //Here the app name is uml-activity
When prompted, choose the default Vue 3 setup.
Step 4: Navigate to the newly created app directory using the command below:
cd uml-activity
Step 5: Run the following command to launch your Vue app.
npm run serve
This will open your app in your default web browser at http://localhost:8080 / (or a similar address).
Step 6: Install the necessary Syncfusion Diagram packages using the following commands.
npm install @syncfusion/ej2-vue-diagrams @syncfusion/ej2-diagrams @syncfusion/ej2-base @syncfusion/ej2-popups
Step 7: Add the dependent scripts and style CDN reference links to your public/index.html file.
<head>
    <meta charset="utf-8">
    <meta http-equiv="X-UA-Compatible" content="IE=edge">
    <title>Vue UML Activity Diagram</title>
    <script src="https://cdn.syncfusion.com/ej2/syncfusion-helper.js" type="text/javascript"/>
    <link href="https://cdn.syncfusion.com/ej2/26.1.35/material.css" rel="stylesheet"/>
</head>
Step 8: To include the Vue Diagram component in your app, import DiagramComponent from the @syncfusion/ej2-vue-diagrams package.
Then, update src/App.vue to include the diagram component with arguments, such as the width and height, as shown in the code below.
<template>
    <div id="diagram-space" class="sb-mobile-diagram" style="height: 100vh; width: 100vw;">
        <ejs-diagram id="diagram" :width="'100%'" :height="'100%'">
        </ejs-diagram>
    </div>
</template>

<script>
import { DiagramComponent } from '@syncfusion/ej2-vue-diagrams'; // Import the DiagramComponent

export default {
    name: 'App',
    components: {
        'ejs-diagram': DiagramComponent
    }
}
</script>

<style>
/* Add some basic styling if needed */
#diagram-space {
    display: flex;
}
</style>
The following image illustrates the basic diagram layout.

Note: For more details, refer to the official documentation.
Adding UML activity shapes in the symbol palette
The Vue Diagram Library provides a gallery of reusable nodes and connectors called the SymbolPalette. The SymbolPalette lets you drag and drop reusable UML shapes and connectors. You can easily render built-in UML Activity shapes within the symbol palette. By using the symbols property of each palette, you can define and customize UML shapes.
Follow these steps to create a diagram symbol palette with UML activity shapes.
Step 1: Prepare the container
Start by creating separate <div> elements as the container for the Symbol Palette and the Diagram.
Refer to the following example code in src/App.vue:
<template>
    <div class="container-fluid" style="height: 100vh;">
        <div class="row" style="height: 100%;">
            <div class="col-3" style="height: 100%;">
                <ejs-symbolpalette id="symbolpalette" :width="'100%'" :height="'100%'" :palettes="palettes" :symbolHeight="60" :symbolWidth="60" :expandMode="'Multiple'">
                </ejs-symbolpalette>
            </div>
            <div class="col-9" style="height: 100%;">
                <ejs-diagram id="diagram" :width="'100%'" :height="'100%'" :nodes="nodes" :connectors="connectors">
                </ejs-diagram>
            </div>
        </div>
    </div>
</template>
Step 2: Initialize the symbol palette
We must define the UML Activity shapes and connector symbols to display in the palette.
src/App.vue:
<script>
import { DiagramComponent, SymbolPaletteComponent } from '@syncfusion/ej2-vue-diagrams';
import { NodeModel, ConnectorModel } from '@syncfusion/ej2-diagrams'; // Import Diagram types

let umlActivityShapes = [
    { id: 'Action', shape: { type: 'UmlActivity', shape: 'Action' } },
    { id: 'Decision', shape: { type: 'UmlActivity', shape: 'Decision' } },
    { id: 'MergeNode', shape: { type: 'UmlActivity', shape: 'MergeNode' } },
    { id: 'InitialNode', shape: { type: 'UmlActivity', shape: 'InitialNode' } },
    { id: 'FinalNode', shape: { type: 'UmlActivity', shape: 'FinalNode' } },
    { id: 'ForkNode', shape: { type: 'UmlActivity', shape: 'ForkNode' } },
    { id: 'JoinNode', shape: { type: 'UmlActivity', shape: 'JoinNode' } },
    { id: 'TimeEvent', shape: { type: 'UmlActivity', shape: 'TimeEvent' } },
    { id: 'AcceptingEvent', shape: { type: 'UmlActivity', shape: 'AcceptingEvent' } },
    { id: 'SendSignal', shape: { type: 'UmlActivity', shape: 'SendSignal' } },
    { id: 'ReceiveSignal', shape: { type: 'UmlActivity', shape: 'ReceiveSignal' } },
    { id: 'StructuredNode', shape: { type: 'UmlActivity', shape: 'StructuredNode' } },
    { id: 'Note', shape: { type: 'UmlActivity', shape: 'Note' } },
];

let connectorSymbols = [
    {
        id: 'Link1', type: 'Orthogonal', sourcePoint: { x: 0, y: 0 }, targetPoint: { x: 40, y: 40 },
        targetDecorator: { shape: 'Arrow', style: { strokeColor: '#757575', fill: '#757575' } }, style: { strokeWidth: 2, strokeColor: '#757575' }
    },
    {
        id: 'Link2', type: 'Orthogonal', sourcePoint: { x: 0, y: 0 }, targetPoint: { x: 40, y: 40 },
        targetDecorator: { shape: 'Arrow', style: { strokeColor: '#757575', fill: '#757575' } }, style: { strokeWidth: 2, strokeDashArray: '4 4', strokeColor: '#757575' }
    },
    {
        id: 'Link3', type: 'Straight', sourcePoint: { x: 0, y: 0 }, targetPoint: { x: 40, y: 40 },
        targetDecorator: { shape: 'Arrow', style: { strokeColor: '#757575', fill: '#757575' } }, style: { strokeWidth: 2, strokeColor: '#757575' }
    }
];

export default {
    name: 'App',
    components: {
        'ejs-diagram': DiagramComponent,
        'ejs-symbolpalette': SymbolPaletteComponent
    },
    data() {
       return {
           palettes: [
               {
                   id: 'umlActivity',
                   expanded: true,
                   symbols: umlActivityShapes,
                   title: 'UML Shapes'
               },
               {
                   id: 'connectors',
                   expanded: true,
                   symbols: connectorSymbols,
                   title: 'Connectors'
               }
           ],
           nodes: [], // Will be populated dynamically or pre-defined
           connectors: [] // Will be populated dynamically or pre-defined
       };
    }
}
</script>
Step 3: Customize the symbol appearance
You can customize the symbols as required. In the code below, the styles for the symbols are defined using the getNodeDefaults method.
export default {
    name: 'App',
    components: {
        'ejs-diagram': DiagramComponent,
        'ejs-symbolpalette': SymbolPaletteComponent
    },
    data() {
        return {
            paletteGetNodeDefaults: (symbol) => {
                if (symbol.id === 'JoinNode') {
                    symbol.width = 20; symbol.height = 50;
                } else if (symbol.id === 'ForkNode') {
                    symbol.width = 50; symbol.height = 20;
                } else if (symbol.id === 'Decision' || symbol.id === 'MergeNode') {
                    symbol.width = 50; symbol.height = 40;
                } else {
                    symbol.width = 50; symbol.height = 50;
                }
                if (symbol.id === 'InitialNode' || symbol.id === 'FinalNode' || symbol.id === 'JoinNode' || symbol.id === 'ForkNode') {
                    symbol.style.fill = '#757575';
                }
                symbol.style.strokeColor = '#757575';
            },
            getSymbolInfo: () => {
                return { fit: true };
            },
        };
    }
}
The following image shows the Symbol Palette with UML Activity shapes and connectors.

Note: Check out the symbolpalette documentation for additional details.
Rendering UML shapes in Vue Diagram
UML activity nodes
Let’s create a UML activity diagram representing a Customer Call Log Support workflow.
Step 1: To create a UML activity, define the type as UmlActivity and set the list of built-in shapes in the shape property as InitialNode, as shown in the code below.
nodes: [
    {
        id: 'Start',
        height: 40,
        width: 40,
        offsetX: 300,
        offsetY: 20,
        shape: { type: 'UmlActivity', shape: 'InitialNode' }
    }
]
Refer to the following image.

Step 2: The next step is to log the customer call. We can define this by setting the shape property to Action. Using the annotations property, you can add a text label, Receive Customer Call.
nodes: [
    {
        id: 'Start',
        height: 40,
        width: 40,
        offsetX: 300,
        offsetY: 20,
        shape: { type: 'UmlActivity', shape: 'InitialNode' }
    },
    {
        id: 'ReceiveCall',
        height: 40,
        width: 105,
        shape: { type: 'UmlActivity', shape: 'Action' },
        offsetX: 300,
        offsetY: 100,
        annotations: [{ content: 'Receive Customer Call' }]
    }
]
UML activity connector
To establish a UML activity connector, specify the type of connector shape as UmlActivity and define the flow as either Exception, Control, or Object. This configuration delineates the nature of the connection, allowing for a precise representation of the interaction within the activity diagram.
connectors: [
    {
        id: 'connector1',
        sourceID: 'Start',
        targetID: 'ReceiveCall',
        shape: { type: 'UmlActivity', flow: 'Object' }
    }
]
Refer to the following image.

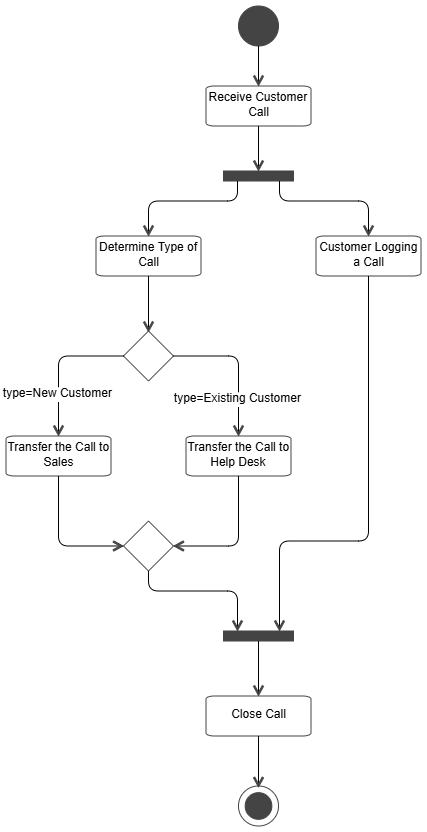
UML activity diagram flow – customer call management
The following UML Activity Diagram demonstrates a structured process for handling customer calls. It includes receiving the call, determining customer type, logging data, and deciding how to proceed. It also uses ForkNode, JoinNode, and MergeNode to manage parallel processing and synchronization.
Nodes overview
- Start (InitialNode): Marks the entry point of the process.
- ReceiveCall (Action): Represents receiving a customer’s call.
- ForkNode: Splits the process into two parallel flows.
- Determine (Action): Determines the type of call.
- Log (Action): Logs the customer’s call.
-
Decision: Decides the call’s next step based on the customer type:
- New custome r: Transfers the call to sales
- Existing customer: Transfers the call to the help desk.
- MergeNode: Merges the paths after handling customer calls.
- JoinNode: Synchronizes the logged call and merged paths.
- CloseCall (Action): Closes the call.
- FinalNode: Marks the process end.
Flow explanation
- The process begins at the start node.
- The call was received and split at the ForkNode.
- Two parallel flows begin:
- Determine the call type that leads to a decision:
- New customers are transferred to sales.
- Existing customers are transferred to the help desk.
- The call is L=logged.
- After handling the call, paths converge at the MergeNode and join at the JoinNode with the logged data.
- Finally, the call is closed, and the process ends at the FinalNode.
The diagram effectively models parallel processing, decision-making, and merging flows in a customer call management scenario.

Adding shapes at runtime
Drag and drop the symbols from the palette. Double-click on nodes and connectors to edit their content and include flow data in the diagram objects.
Refer to the following GIF image.

Loading and saving a diagram
The Vue Diagram Library provides a useful feature that allows you to save your work and resume it later by loading the diagram back onto the diagram canvas.
To save your current diagram, select the *Save Diagram * option in the toolbar. This will save your diagram as a file on your local drive.
To load an existing diagram file, select the *Open Diagram * option in the toolbar. This will open the file dialog box. From there, you can browse and select the diagram file that you want to load.
Refer to the following GIF image.

Export a diagram
You can export the UML activity diagram as an image file in different formats, such as JPEG, PNG, and SVG.
To do this, click the export button in the toolbar and select the required image file format. You can choose to export only the content area of the diagram, excluding blank spaces, or export the entire canvas, including blank spaces, based on the width and height set in the page settings.
Check out the official documentation for additional details.
Refer to the following image.

Print a diagram
To print a diagram, click the Print ** button in the toolbar. This will open the **Print dialog box, where you can select your printer and customize the print settings, such as orientation, paper size, and page margins. Then, click on the Print button to print the UML Activity diagram.
Refer to the following image.

Pan and zoom
The Vue Diagram Library supports the following pan options.
- Scrollbars: The most straightforward way to pan a diagram is to use the scrollbars on the right side and bottom. These allow you to scroll the diagram in the desired direction.
- Mouse wheel: You can also pan a diagram by using the mouse wheel. To scroll up or down, rotate the mouse wheel forward or backward; to scroll left or right, hold Shift while rotating the scroll wheel forward or backward.
- Pan tool: You can also pan a diagram by selecting the Pan tool from the toolbar. Then, hold down the left mouse button and drag the mouse to move the diagram in any direction. Refer to the following image.

Zoom: The most efficient way to zoom in and out of the diagram is to use the Ctrl + mouse wheel shortcut.
Reference
For more details, refer to the StackBlitz demo
Conclusion
Thanks for reading! This blog shows how to easily create a UML activity diagram using the Syncfusion Vue Diagram Library. Similarly, you can create diagram creation apps like an organization chart creator, a flow chart creator, or a network diagram creator.
If you’re a Syncfusion user, you can download the setup from the license and downloads page. Otherwise, you can download a free 30-day trial .
You can also contact us through our support forums, support portal, orfeedback portal for queries. We are always happy to assist you!
Related Blogs
- Easily Create UML Activity Diagrams with React Diagram Library
- Easily Create Interactive UML Class Diagrams in Angular
- How to Build an AI Text-to-Flowchart Converter Using OpenAI and Vue Diagram
- Easily Create Interactive Floor Planner Diagrams in Vue
This article was originally published at Syncfusion.com.

Top comments (0)