
A choropleth map is a specialized type of geographic map in which regions are highlighted by color based on the data of those areas. They are appropriate for visualizing regional patterns in data. The higher the value is, the darker the color will be in that region. This will be helpful to understand trends in the data with a quick look. In this blog post, I will explain how to create a choropleth map easily using the Syncfusion Xamarin Maps control.
A choropleth map works perfectly for showing data across a region and how data varies across a geographic area or the level of variability within a region. It is used to showcase the data of a region relative to the data of the nearby regions, like for population density, COVID-19 cases, GDP growth, election results, average rain fall, literacy rates and weather.
Add choropleth maps to the Xamarin Maps shape layer
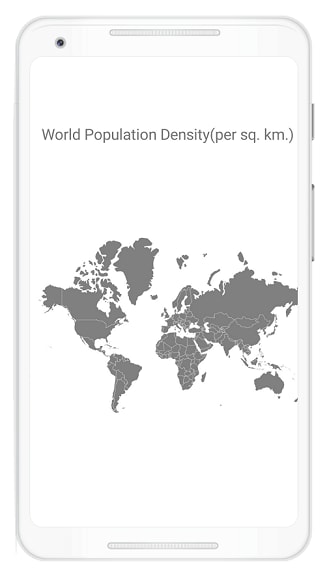
We are going to create a choropleth map to show the world’s population density. For that, we need to render the basic world map first.
Create an instance of the Xamarin Maps control with the shape layer that contains the basic word map. Check out our getting started with Xamarin Maps documentation.
<sfmaps:SfMaps >
  <sfmaps:SfMaps.Layers>
     <sfmaps:ShapeFileLayer Uri="world-map.shp">
     </sfmaps:ShapeFileLayer>
  </sfmaps:SfMaps.Layers>
</sfmaps:SfMaps>
Note: You can add a title for the choropleth map using the labels feature in the Xamarin Maps control.
Populate data and link to the Maps
Then, we need the world population density data to be mapped. Let’s define a model and view model data for it as shown in the following code example.
public class ViewModel
    {
        public ObservableCollection<CountryDensityModel> WorldPopulationDensityDetails { get; set; }
        public ViewModel()
        {
            WorldPopulationDensityDetails = new ObservableCollection<CountryDensityModel>();
            WorldPopulationDensityDetails.Add(new CountryDensityModel("Taiwan", 672));
            WorldPopulationDensityDetails.Add(new CountryDensityModel("Bangladesh", 1265));
            WorldPopulationDensityDetails.Add(new CountryDensityModel("Israel", 400));
            WorldPopulationDensityDetails.Add(new CountryDensityModel("Tuvalu", 393));
            WorldPopulationDensityDetails.Add(new CountryDensityModel("Belgium", 382));
            WorldPopulationDensityDetails.Add(new CountryDensityModel("Curacao", 369));
            WorldPopulationDensityDetails.Add(new CountryDensityModel("Philippines", 367));
            …
            …
            …
        }
    }
    public class CountryDensityModel
    {
        public CountryDensityModel(string countryName, double density)
        {
            this.CountryName = countryName;
            this.Density = density;
        }

        public string CountryName { get; set; }
        public double Density { get; set; }
    }
Next, assign the populated data source to the map’s ItemsSource property. Also, link the shape files and populated data with the ShapeIDTableField, and ShapeIDPath properties, respectively.
Refer to the following code.
<sfmaps:SfMaps >
  <sfmaps:SfMaps.Layers>
     <sfmaps:ShapeFileLayer Uri="world-map.shp" ItemsSource="{Binding WorldPopulationDensityDetails}" ShapeIDTableField="name" ShapeIDPath="CountryName">
     </sfmaps:ShapeFileLayer>
  </sfmaps:SfMaps.Layers>
</sfmaps:SfMaps>
Apply colors to the regions
Now, we have implemented the basic requirements for creating a choropleth map using Syncfusion Xamarin Maps. Each country data item has the country name and population density.
Now, return the density value of each country and map it to the ShapeSetting’s ShapeColorValuePath property.
Refer to the following code.
<sfmaps:ShapeFileLayer Uri="world-map.shp" ItemsSource="{Binding WorldPopulationDensityDetails}" ShapeIDTableField="name" ShapeIDPath="CountryName" >
  <sfmaps:ShapeFileLayer.ShapeSettings>
      <sfmaps:ShapeSetting ShapeColorValuePath="Density" >
      </sfmaps:ShapeSetting>
  </sfmaps:ShapeFileLayer.ShapeSettings>
</sfmaps:SfMaps.Layers>
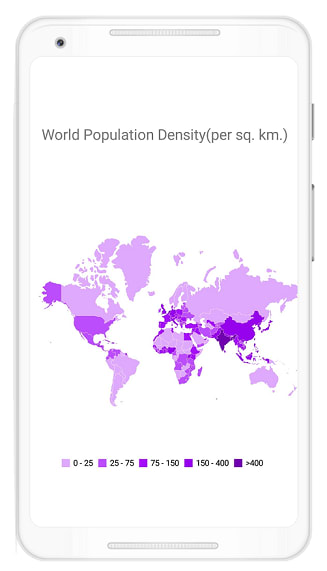
Now, apply colors to the regions based on the value of their density and the range in which it falls. For example, if the density falls between 100 to 200, the region will be shown in a light color, and if it is between 201 to 300, then it will be a dark color. We will set these instructions using the RangeColorMapping support.
Refer to the following code.
<sfmaps:SfMaps >
 <sfmaps:SfMaps.Layers>
   <sfmaps:ShapeFileLayer Uri="world-map.shp" ItemsSource="{Binding WorldPopulationDensityDetails}" ShapeIDTableField="name" ShapeIDPath="CountryName" >
     <sfmaps:ShapeFileLayer.ShapeSettings>
       <sfmaps:ShapeSetting ShapeColorValuePath="Density" >
         <sfmaps:ShapeSetting.ColorMappings>
           <sfmaps:RangeColorMapping From="0" To="25" Color="#dfa9fe" LegendLabel="0 - 25" />
           <sfmaps:RangeColorMapping From="25" To="75" Color="#bd4efd" LegendLabel="25 - 75" />
           <sfmaps:RangeColorMapping From="75" To="150" Color="#a611fc" LegendLabel="75 - 150" />
           <sfmaps:RangeColorMapping From="150" To="400" Color="#9703ec" LegendLabel="150 - 400"/>
           <sfmaps:RangeColorMapping From="400" To="50000" Color="#7002b0" LegendLabel=">400"/>
         </sfmaps:ShapeSetting.ColorMappings>
       </sfmaps:ShapeSetting>
     </sfmaps:ShapeFileLayer.ShapeSettings>
   </sfmaps:ShapeFileLayer>
 </sfmaps:SfMaps.Layers>
</sfmaps:SfMaps>

You can also apply colors based on the exact values. For example, red for 100, yellow for 200, etc. This is another way of color mapping in the Xamarin Maps.
Note: For more details, you can refer to equal color mapping in Xamarin Maps.
Add a legend
Legends provide a clear picture of the data plotted in maps using colors and brief text. This will further improve the data visualization and help us understand the trends in the data easily in the choropleth maps.
Legends can be added using the LegendSettings in the shape file layer and positioned using the LegendPosition property.
Refer to the following code to add a legend in the choropleth map.
<sfmaps:SfMaps >
 <sfmaps:SfMaps.Layers>
   <sfmaps:ShapeFileLayer Uri="world-map.shp" ItemsSource="{Binding WorldPopulationDensityDetails}" ShapeIDTableField="name" ShapeIDPath="CountryName" >
     <sfmaps:ShapeFileLayer.ShapeSettings>
        <sfmaps:ShapeSetting ShapeColorValuePath="Density" >
            <sfmaps:ShapeSetting.ColorMappings>
               <sfmaps:RangeColorMapping From="0" To="25" Color="#dfa9fe" LegendLabel="0 - 25" />
               <sfmaps:RangeColorMapping From="25" To="75" Color="#bd4efd" LegendLabel="25 - 75" />
               <sfmaps:RangeColorMapping From="75" To="150" Color="#a611fc" LegendLabel="75 - 150" />
               <sfmaps:RangeColorMapping From="150" To="400" Color="#9703ec" LegendLabel="150 - 400"/>
               <sfmaps:RangeColorMapping From="400" To="50000" Color="#7002b0" LegendLabel=">400"/>
            </sfmaps:ShapeSetting.ColorMappings>
          </sfmaps:ShapeSetting>
        </sfmaps:ShapeFileLayer.ShapeSettings>
        <sfmaps:ShapeFileLayer.LegendSettings>
           <sfmaps:MapLegendSetting ShowLegend="True" LegendPosition="50,90" />
      </sfmaps:ShapeFileLayer.LegendSettings>
   </sfmaps:ShapeFileLayer>
 </sfmaps:SfMaps.Layers>
</sfmaps:SfMaps>
GitHub reference
You can get the complete sample in the Display Choropleth Maps using Xamarin Maps demo.
Conclusion
Thanks for reading! In this blog, we have learned how to easily create a choropleth map using the Syncfusion Xamarin Maps Control. With this, you can easily visualize the trends in data. So, try out the instructions provided in this blog and tell us about your experience in the comments section below.
You can go through our Xamarin Map’s complete user guide and demos available at this GitHub location. Additionally, you can download our demo apps from Google Play and Microsoft Store.
You can also contact us through our support forums, Direct-Trac, or feedback portal. We are always happy to assist you!

Oldest comments (0)