The Firebase suite includes multiple products in which you can read more about here. In this article, however, I'm going to talk about the Performance Monitoring product.
I'm going to show you how to use it in an Angular app but the process for React, VueJS, etc. is very very similar.
What Is Performance Monitoring in Firebase?
Thanks to this product, you can observe the performance of your app. By using the product, you see the areas for improvement in your code. This product can help you avoid crashes by increasing your code quality.
Features Of Performance Monitoring
- Customize monitoring for your app
- Automatically measure app startup time, HTTP/S network requests, and more
- Gain insight into situations where app performance could be improved
Let's get started
Note: I'm assuming you have a Firebase account and any project there that can be used throughout this article.
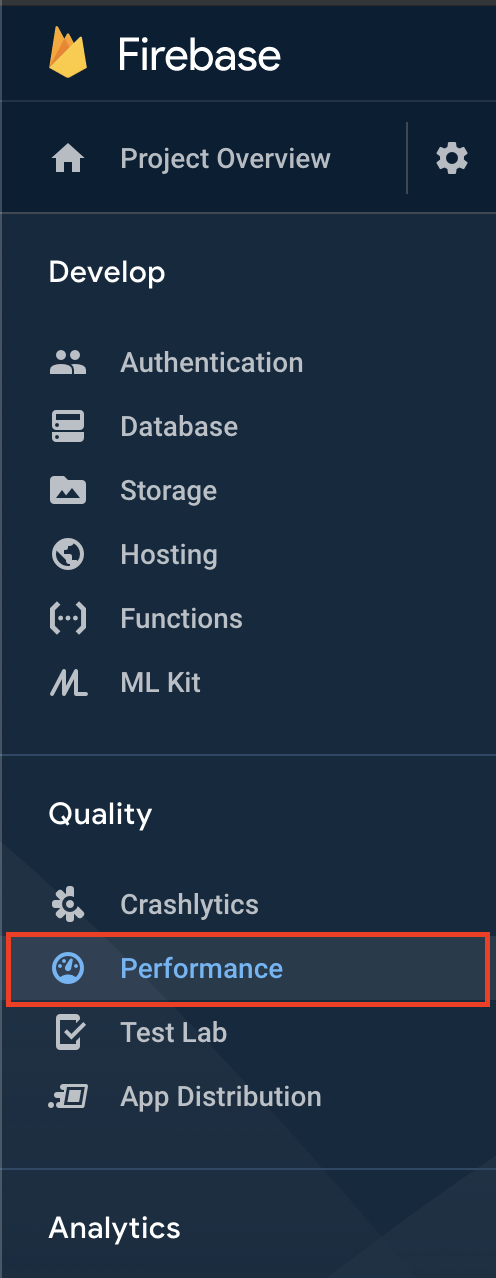
1) On the left navbar, inside of a Firebase console, you will see Performance. Click on it. This is where your data will be populated after 12-24hrs of monitoring.
2) Now go to project settings:

3) Then scroll all the way down and copy/paste the JSON with all your project settings in a safe place. If you don't see those settings as shown on the screenshot, you might need to register a new web-app for the current project (instructions on how to do this are given on the same page in Project settings > General).
4) Navigate to your project directory in the command line and run:
npm install firebase @angular/fire --save
5)Import the Firebase modules in your app.module.ts
import { AngularFireModule } from "@angular/fire";
import { AngularFirePerformanceModule } from "@angular/fire/performance";
6) Inside of your app.module.ts, make sure you add the above modules into the imports array as followed:
imports: [
    ...
    // These are settings that you copied in step #3
    AngularFireModule.initializeApp({
      apiKey: "...",
      authDomain: "...",
      databaseURL: "...",
      projectId: "...",
      storageBucket: "...",
      messagingSenderId: "...",
      appId: "..."
    }),
    AngularFirePerformanceModule,
    ...
]
7) Now in your service, or wherever you are reading the data from Firebase, you can add a trace to trace the time it takes to load the data.
...
import { AngularFirestore } from "@angular/fire/firestore";
import { AngularFirePerformance } from "@angular/fire/performance";
...
constructor(
    private perf: AngularFirePerformance,
    private firestore: AngularFirestore
  ) {}
firestorePlacesCollection = this.firestore.collection("places");

  //READ
  places$ = this.firestorePlacesCollection.snapshotChanges().pipe(
    // HERE IS THE TRACE
    this.perf.trace("placesQuery"),
    map(actions => {
      return actions.map(p => {
        const place = p.payload.doc;
        const id = place.id;
        return { id, ...place.data() } as Place;
      });
    })
  );
Note: places is the name of my collection inside of Firebase and placesQuery is the name I gave to my trace. You can name it however you want.
_Now your app is ready to start getting tracked by Firebase's performance tooling.
_
Remember: you can always write custom traces whether you are using Angular, React, or plain Vanilla JS.
Time to view our App Performance
Note: In order to see your app performance, you need to deploy your app and give Firebase approximately 24 hours to collect some data.
7) Go back to Firebase -> Performance Tab and you should see something like this:

You will see this dashboard showing some basic data per country and per environment you have used your app.
8) Now, click on View Traces, and click on the environment you want to be the traces. You will see a metrics dashboard

If you click on View More, you will see more information about that specific metric. Check it out!
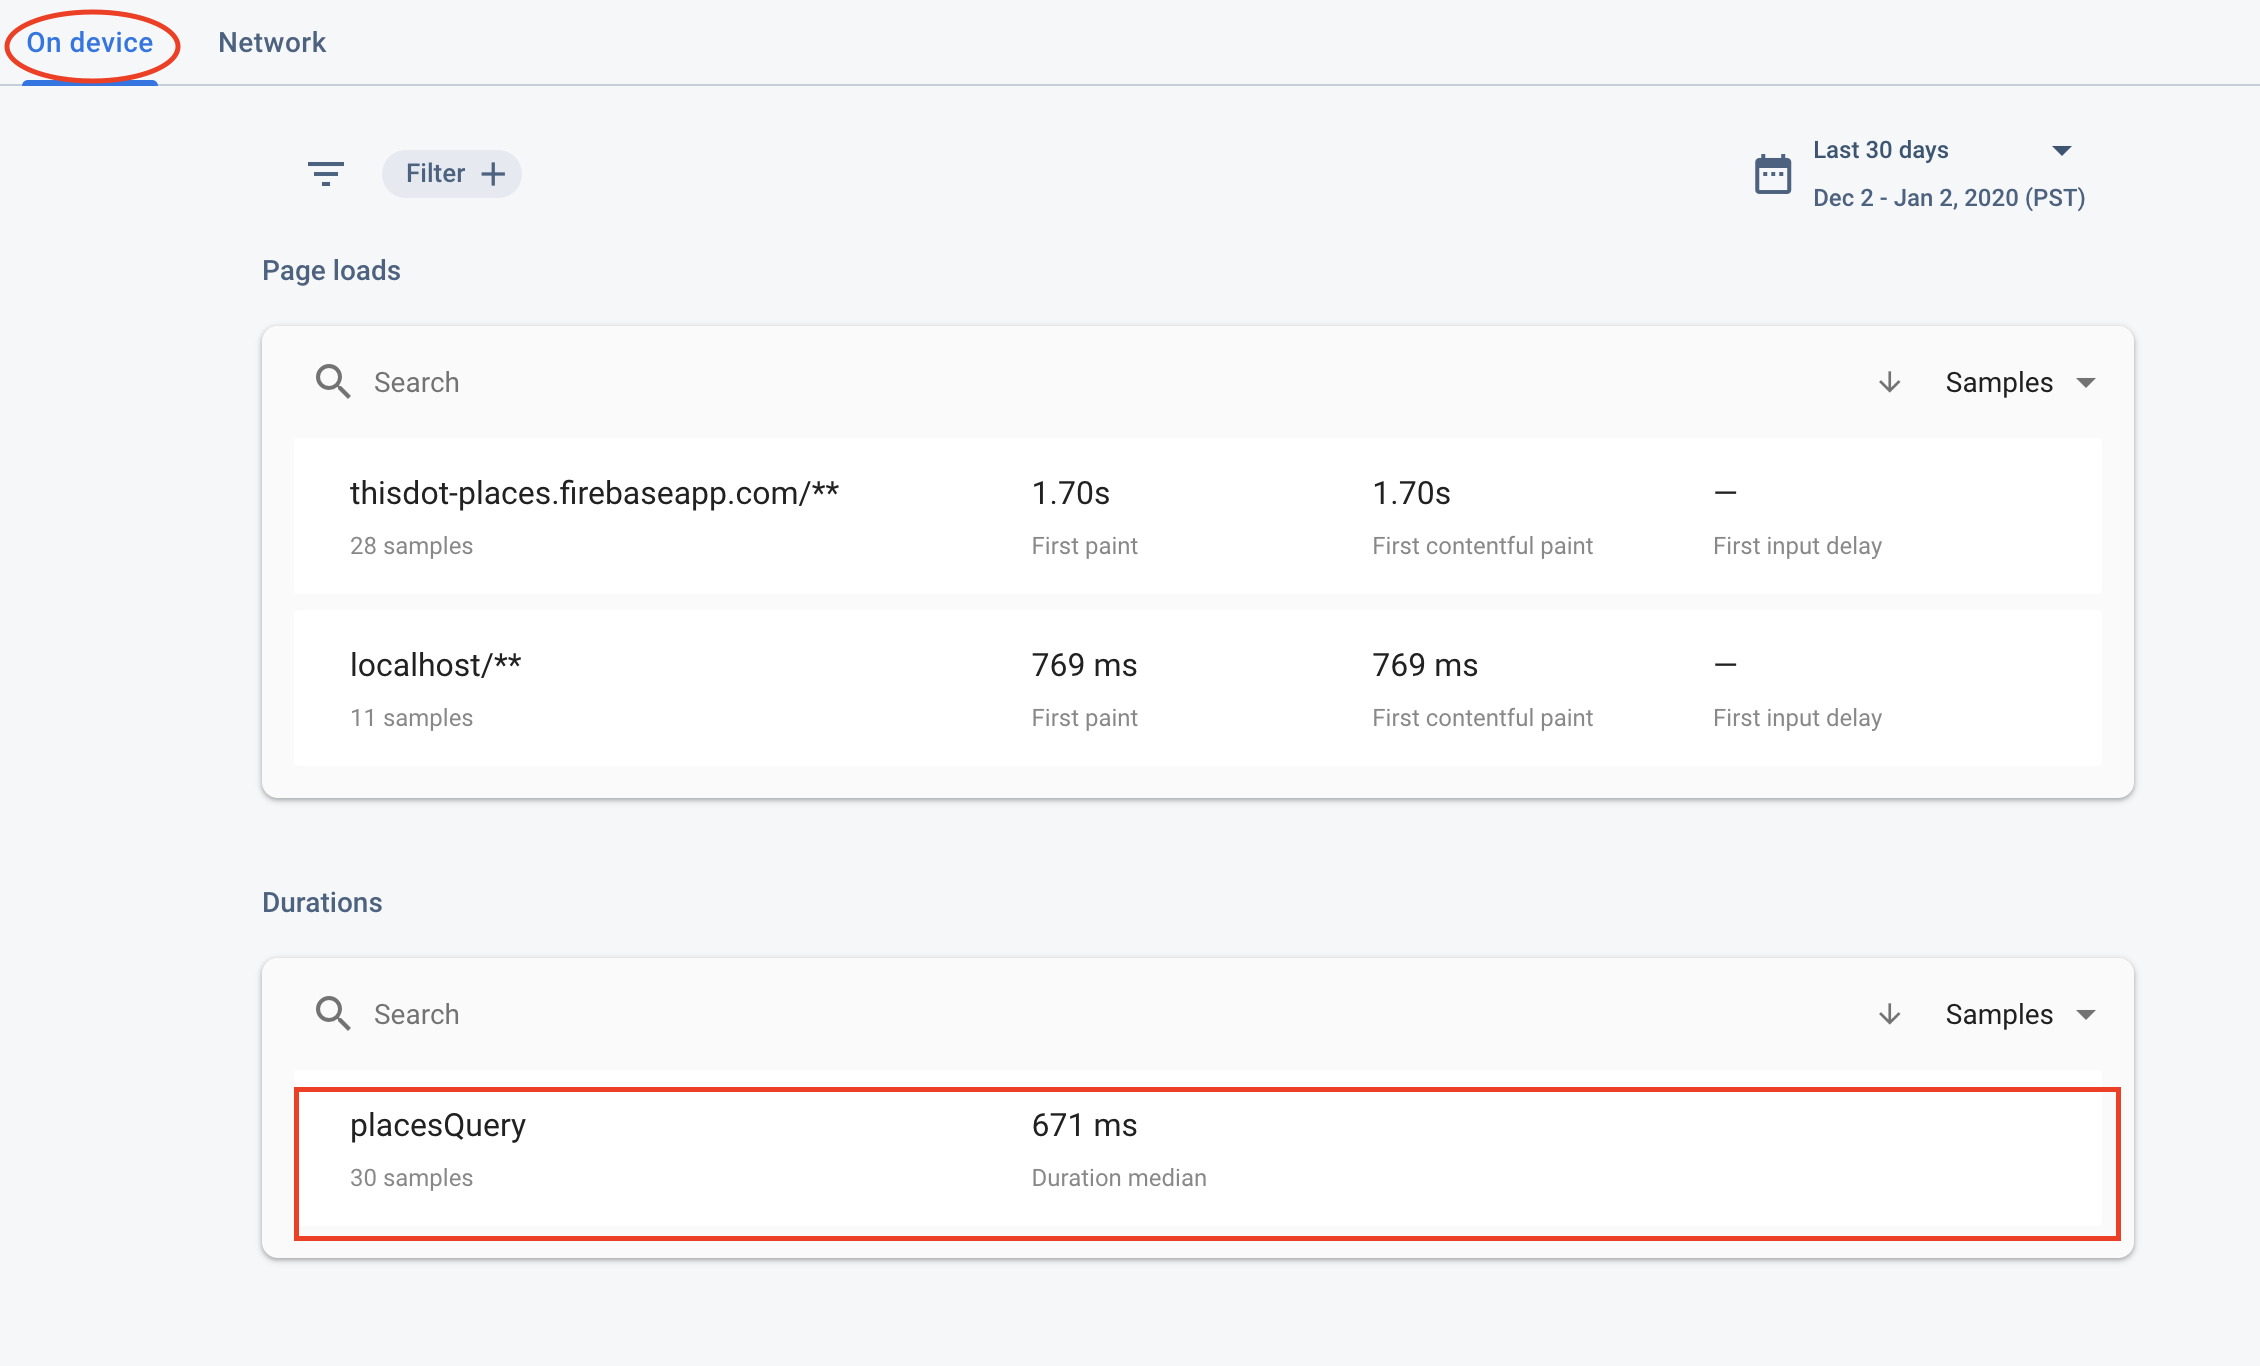
9) Now go back to the previous page and click on device tab then click on the trace you created to view the performance data. In my case, my custom trace is placeQuery.
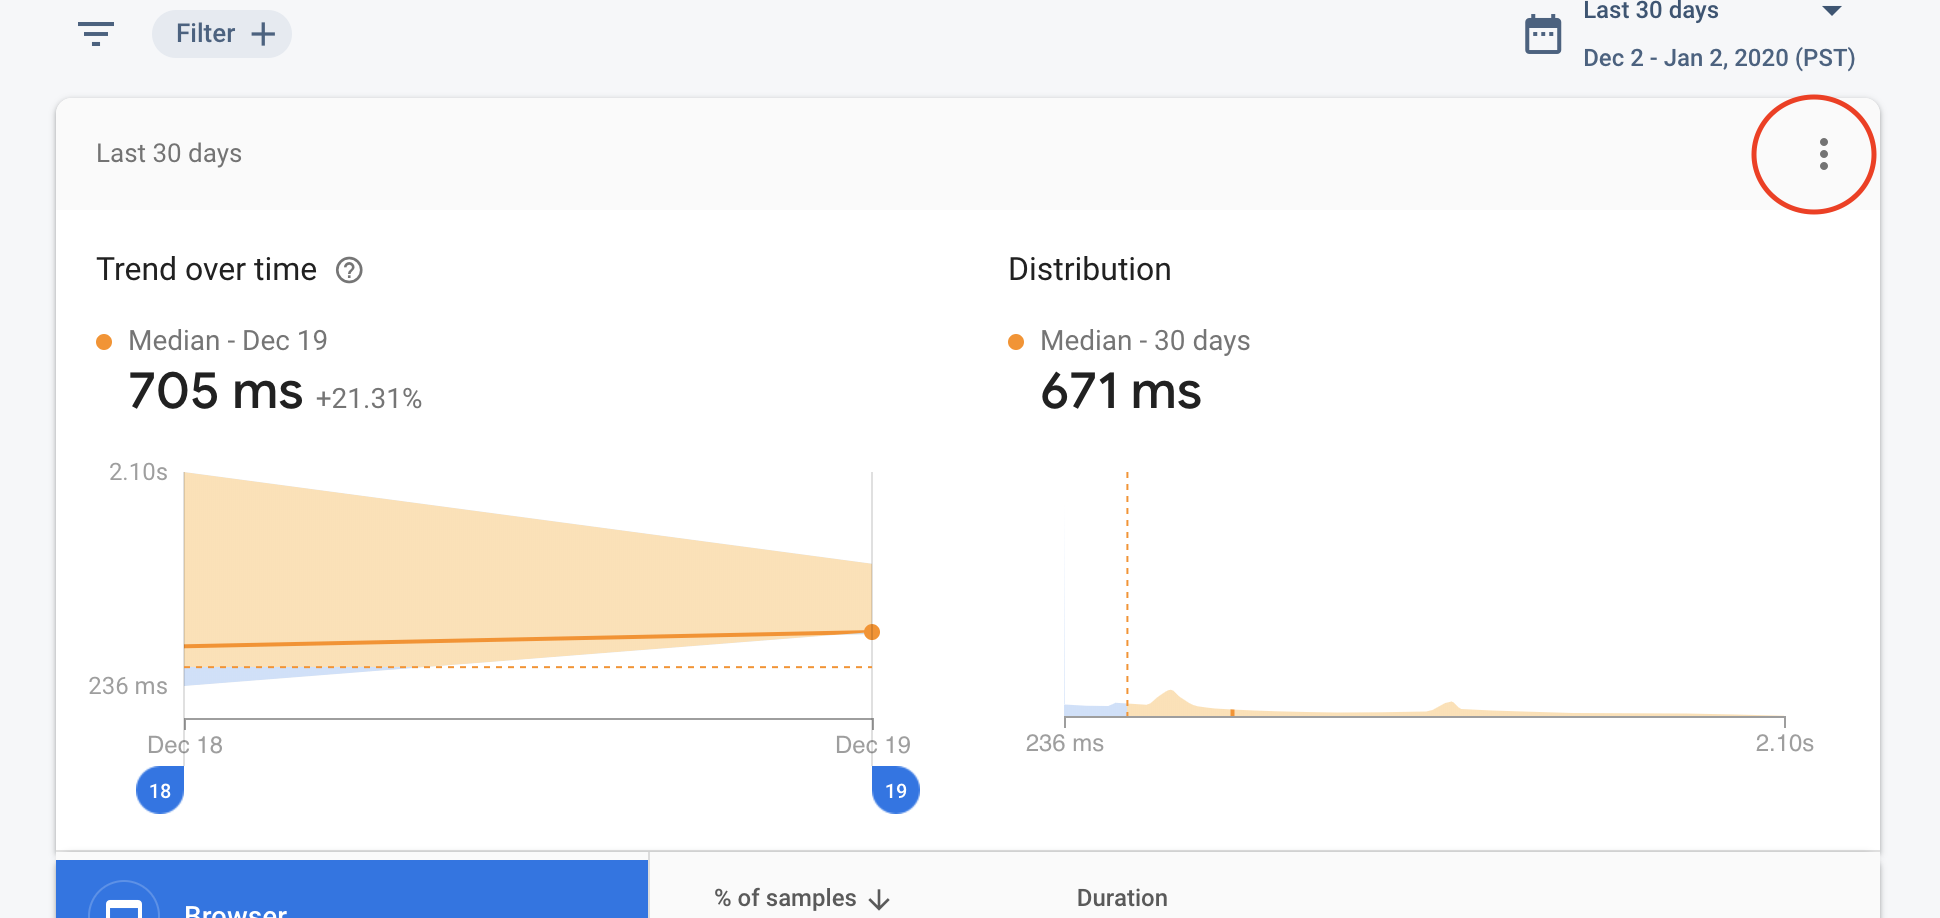
10) After clicking on the custom trace, you will see a dashboard that is similar to the one in the picture below. Click on View More.
11) After clicking on view more, you will see some specific traces related to your custom trace.

As you can see, you have the option to see the metrics depending on different factors like the browser, country, etc.
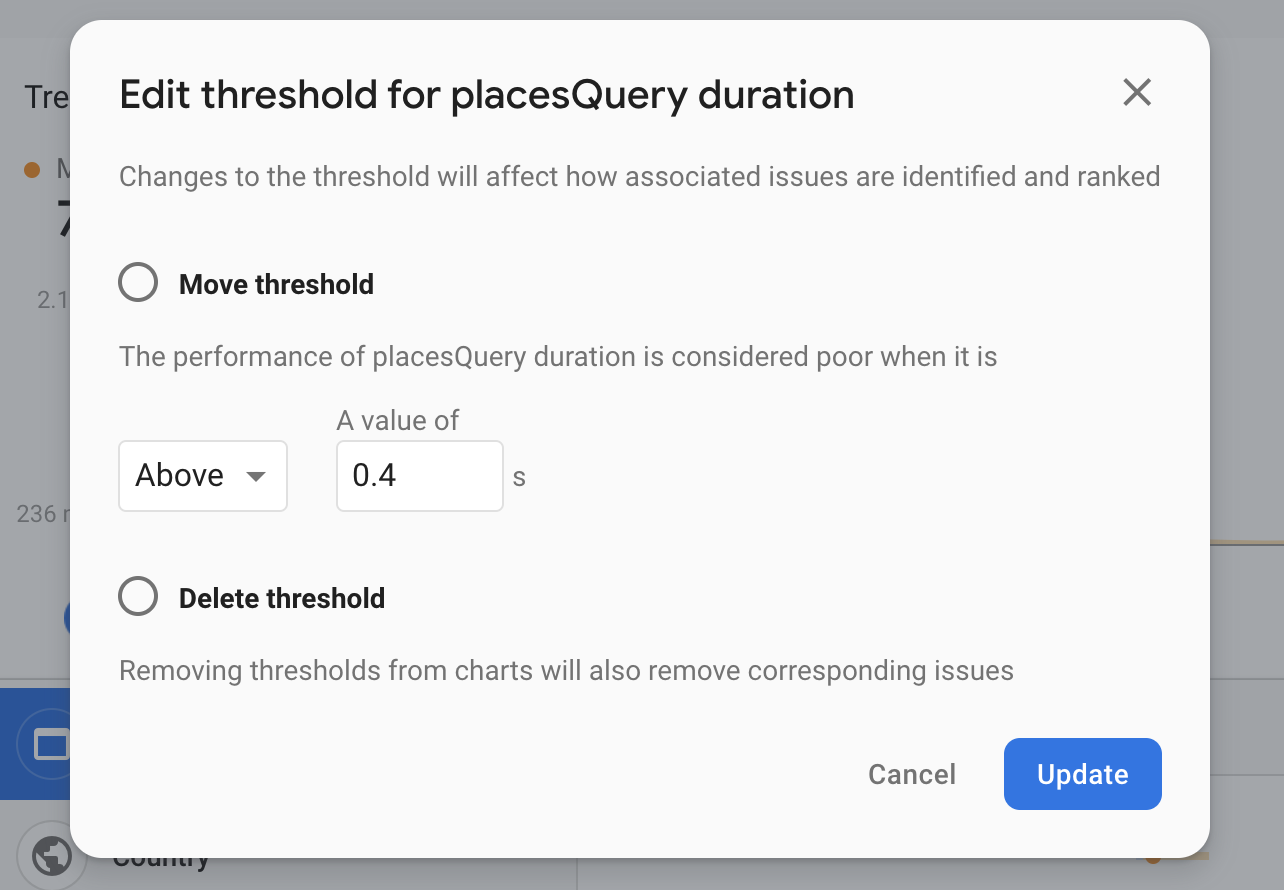
12) You can also set parameters to see when the performance on the page is below the average by setting a threshold.
All of these performance metrics will help you understand how your app performs in different conditions to improve the user experience for your customers.
This Dot Inc. is a consulting company which contains two branches: the media stream, and labs stream. This Dot Media is the portion responsible for keeping developers up to date with advancements in the web platform. This Dot Labs provides teams with web platform expertise, using methods such as mentoring and training.


Top comments (0)