An Overview of Performance in JavaScript Applications
Warning ⚠ - this is not a short post, though I hope it can serve as a useful point of reference to those looking to enhance the performance of their app(s).

Performance on the web is a vast and sprawling topic. There are so many facets to performance that can be considered; each project will have a different set of requirements and may need to focus on performance more or less depending on what is trying to be achieved. As the web evolves and more layers of logic and computation get added, it can be easy for performance to take a hit.
This post will just scratch the surface and give an overview into some of the ways that performance can be affected; it won't go too in-depth into any particular region of performance or library - instead it will be primarily focussed around different aspects of performance to be aware of. Due to the focus being a high-level overview, there also aren't many specific code examples.
There are always some aspects to frontend performance that are out of your control; particularly when using JavaScript - the most performant sites will be ones with little/no JavaScript (though that isn't realistic with the requirements of many websites):
- The site's resources still have to be downloaded by the client. Even though you can help mitigate this with the way that you bundle the app, the performance is ultimately determined by network speed.
- JavaScript often interfaces with a variety of API's. While network speed is a factor here as well, the performance is also impacted by how long an API takes to handle the request and send a response.
Table of Contents
Initial Load
One of the most impactful performance factors in an app is how long it takes for the initial resources to load (/download). Generally, the more complex an app is, the larger the resources are that must be loaded.
Resource download is particularly critical for users on lower-end networks that don't have the same level of speed and consistency as 4G and 5G. The Speedtest Global Index gives an insight into the disparity between network speeds across the world. Helping to improve the performance and load-times for our applications can have a massive benefit to users with slower network connections, and is an important step towards ensuring that we're making the web as accessible as possible.
It is going to become increasingly easier for developers to serve their applications in a different manner depending on the users connection speed, via a technique known as adaptive serving. Based on the users connection speed, the assets that are being sent to the user are adapted (such as high quality video compared to low quality video).
There is a myriad of statistics available showing how significant initial load times are, but here's some of the highlights:
- 53% of mobile users abandon websites that take longer than 3 seconds to load - Google, 2016
- For every additional second a page takes to load, 10 percent of users leave - BBC, 2016
- 90% increase in bounce probability when page load speed dropped from 1 to 5 seconds, according to Google’s neural-network predictive model - Google, 2017
Shaun Anderson has compiled a great list of resources and statistics that detail the importance and benefits of fast load times.
If the above statistics weren't enough to convince you of how important initial load is, improving a site's load speed is also reported to have a positive effect on its SEO rankings, though Google hasn't disclosed how major the impact is.
An easy way to improve load speeds for your web page is to utilise caching. Two of the main ways that resources/assets are cached is via browser caching and CDN caching.
Browser Caching
This is where the user's browser will store resources in a cache so that the next time the same user visits the site it is able to retrieve the resources from local data rather than via HTTP. Because resources are stored locally, a user has to visit a site before its resources can be cached.
Increasingly, developers are becoming able to have more granular control over what resources are cached, and under what circumstances they would like the cache to be invalidated. One good example of an API to do this, is via Google's Workbox.
A user can choose to delete their local/browser cache at any time.
CDN Caching
Caching is one of the main advantages a CDN (content delivery network) has to offer. Sharing similarities with browser caching, a CDN cache aims to store resources for a particular app. The main difference being that a CDN stores the resources on a server in a geographically close location to a user, instead of on their local computer - meaning that there is less distance for the resources to travel, giving users accelerated access to the app's content.
Link Prefetching
Browser's have the ability to prefetch specified resources that the user might need in the future, storing them in the cache. This means that when a user visits one of the prefetched resources, it can be quickly retrieved from the cache, aiding performance and reducing the dependency on a consistent network connection. Ivan Akulov has written a great article on the different <link rel> tags that are available in order to bolster performance by retrieving resources in advance.
Downloading the JS
How you choose to download the necessary JS can have an knock-on performance impact. Ideally, you want start with the JS that is needed for the first few actions, delaying the download of other JS so that the user experience is as smooth as possible.
When embedding/referring to scripts in HTML there are some performance focussed attributes that can be used (as per the below image):
-
script- the use of a regular script tag will block HTML parsing while the script is downloaded and executed. -
script async- HTML5 added theasyncattribute which allows for JS to be downloaded in parallel to parsing. If being used in conjunction with a JS module script the entire dependency tree will be fetched in parallel. As soon as fetching of the JS is finished, it will be executed. -
script defer- similar to theasyncattribute, this provides an alternative to blocking the parser with JS, the difference being that it waits for parsing to complete before execution.
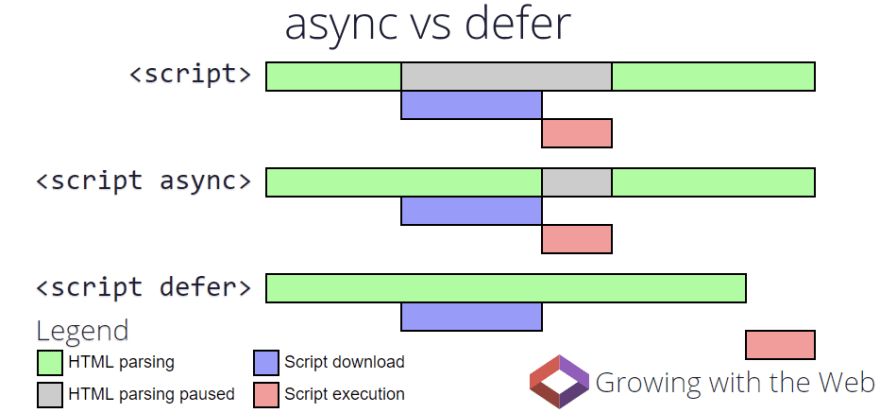
Picture credit Growing with the Web
Streams
The Streams API includes a really exciting set of new tools for performance. They allow JavaScript to receive data via a readable stream instead of having to receive it all at once. The potential for utilising the Streams API is huge and can allow for much faster initial renders while remaining data is then received progressively over time.
Streams form part of a change in perspective towards how we think about data processing (UI's should be fluid and stream-driven rather than overly structured and static, though that is a whole other topic) and can be applied to help with both initial load performance and ongoing performance.
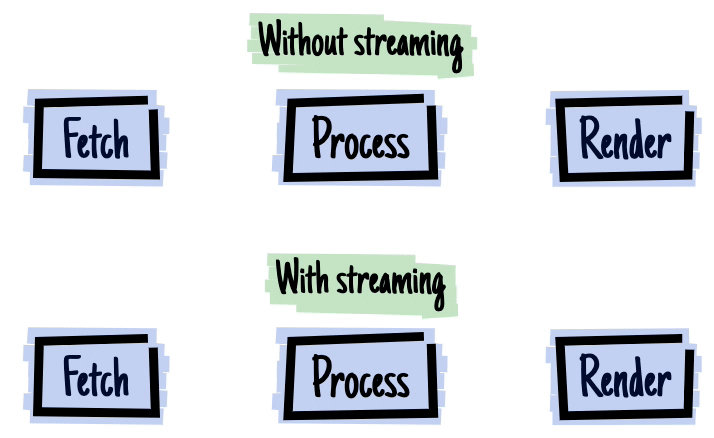
Gif/Video credit to Jake Archibald
Third Party Scripts
No matter how much control you have over your JavaScript that the client downloads, as soon as a third-party script is added to the page - that control is lost. Examples of widely-used third-party scripts are Google Tag Manager and Facebook Pixel.

Third party scripts can be of any size, and can drastically impact the performance of your app. They are often deemed as a requirement for large projects, however, their performance impact should be well evaluated and considered before a decision is made.
If using third party scripts - it may be prudent to load them with the above async or defer attributes so that they do not interrupt the page's parsing. If you're looking for other ways to improve third party script performance check out this article.
Bundling
When it comes to improving initial load/download performance (and metrics such as Time To Interactive) in modern apps; bundling is key. Bundling, is a technique used to put your code, resources, and dependencies into one or more bundles.
These bundles can combine a number of different resources (JS, CSS, HTML, images etc.) and transform them into a smaller number of performant bundles. Depending on the bundler being used, lots of configurability can be applied to the bundling process in order to emit bundles that suit the needs of your app.
Initially, one of the main selling points of bundling was that there were a smaller number of files to download. However, seeing as all evergreen browsers now utilise HTTP/2, this is no longer problematic as sending data in parallel is now possible without having to use multiple TCP connections via multiplexing.
In modern development - bundling is primarily used to transform the beautiful code we write into ugly, performant, and executable code made available to our users.
- Most modern apps require code to be transpiled before it can be ran on a browser. CSS-in-JS/SASS needs to be converted to CSS, JSX (if using React) needs to be converted to JS, Svelte components have to be compiled.
Bundle Size
Bundle size (collective bundle size as opposed to single bundle size) is one of the most quantifiable ways to estimate performance/initial load times. This is because it is quite simple to compare bundle sizes and evaluate how long it might take to download that amount of data at a certain network speed.
BundlePhobia is a great tool that can visually detail the (bundle size) cost by adding an NPM package; allowing you to make a more informed decision about the benefit of adding the package vs the performance/bundle cost.

Addy Osmani recommends splitting bundles that are larger than 50-100kb. When code splitting in this manner, lazy loading becomes much more beneficial - essentially delaying the import of certain bundles/functionality until a certain trigger event has been performed. Code-splitting and lazy-loading can be very finely tuned if required and I urge you to read about them both in detail to see how they might be able to help with your app.
So, knowing how important load times and bundle sizes are, how can you actually reduce the bundle size...?
Tree Shaking

Picture credit goes to Pokemon Sword & Shield
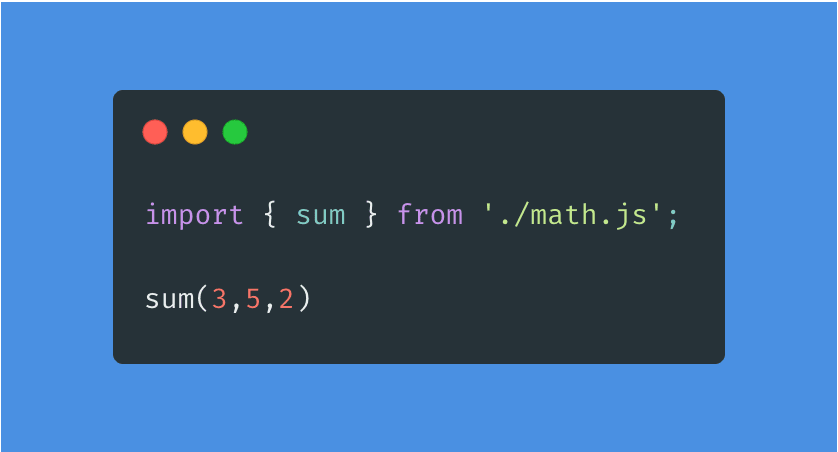
Tree shaking is all about dead code elimination - with the goal of tree shaking being to only include the code that is required for the app to run. Tree shaking has been made possible by the static structure of ES2015 modules; meaning that the the dependencies of an app can be determined by the static syntax, no code execution required. For the same reason, when you use dynamic import it makes the module ineligible for tree shaking.
In the below example we import a function sum from math.js . math.js also includes other utility functions such as square and divide . However, because JS bundlers can statically scan the code to see which exports are being used, only the sum function will be included in the production bundle.
Different bundlers perform tree shaking differently. For more info about tree shaking and how it is implemented in Webpack, take a look here.
Backwards Compatibility / "Untranspiling"
Backwards compatibility is always a major factor to consider in relation to bundle sizes. As a rule of thumb, the more browsers and browser versions a site has to support, the larger the bundled code will be; this is due to newer syntax being less verbose than the backwards-compatible versions of JavaScript. If you are able to focus on evergreen browsers and drop support for browsers such as IE, this could have a solid impact on your bundle size.
Recently, there has been more traction around untranspiling (I'm not sure if that has yet been coined as an official term), which essentially aims to do the opposite of what Babel does - converting older ES5 JavaScript code to ES2015 and newer. This could reduce the bundle sizes of most libraries by as much as 20-30%.
Jovi De Croock has created a brilliant POC app to showcase how major the differences in bundle sizes can be between a modern module build vs a legacy one. Spoiler: the built size of the module build is almost 50% smaller than the legacy one; if that differential is extrapolated to a larger-size application, the impact on load times could be dramatic.
As syntax evolves and becomes less verbose, if you are able to ship bundled code full of syntactic sugar (with less polyfilling/backwards-compatibility support), this will in turn have a positive effect on your final bundle size.
Images
In 2018, images made up a substantial 21% of the average site's content/weight; since then, the impact of images on a site's size has increased sharply putting the number today closer to a whopping 40% of the downloaded content on the modern web. Small image optimisations could have a remarkable knock-on effect to your app's performance.
The designated size of the image on the page should dictate the size of the image that is downloaded, saving unnecessarily large images from being downloaded and bloating the bundle size. DPR (Device Pixel Ratio) is the preferred technique for determining image size as regular pixel measurements are now often far too inaccurate with the wide range of pixel densities on modern devices.
HTML has a bunch of built-in functionality to help with image optimisation, so no need to write lots of funky complex code to do it manually. The srcset attribute on an element allows you to specify a designated set of image sizes, allowing the browser to select the appropriate one for the current viewport.
There are progressive (enhancement) techniques that can be used so that a low quality image is initially downloaded, and then replaced with higher quality versions over time. This is great as it means the core content of the page is available on the user's browser more quickly, before being replaced or complimented with more nuanced and aesthetically pleasing features over time. One example of a utility for this is the [gatsby-image](https://www.gatsbyjs.org/docs/gatsby-image/ blur up technique. If you did decide to build your web app with Gatsby, gatsby-image also has a ton of other functionality to help make images performant.

An example of how progressive image rendering might look
JavaScript Execution
While a site's initial load is majorly impactful to performance, as the word implies it is primarily related to the performance at the start of a session.
To help aid a smooth UI experience throughout a session (especially in larger/more complex apps) it is imperative that the execution of the JS is optimised.
Memoization
In simple terms, memoization is essentially storing the result of an expensive computation in some sort of cache so that when the computation (or function call) is ran again with the same data/inputs, the cached result can be returned. As a rule of thumb it's generally more performant to memoize everything that will be called many times during the session (this is especially important in component driven development).
The below code shows a basic implementation of a memoized function generator. The specified computation function will only be ran again if the parameters change (or are passed in a different order in this case), if not, the value will just be returned from the cache.

There are already a ton of articles that go into more details on how you might be able to memoize your JavaScript; or if you're working with a UI library or framework, how to utilise the memoization API's that are likely exposed for you to use.
Execution Time
As a rule of thumb, most heavy lifting shouldn't be performed by the client-side JavaScript. Based on this, processing speed will usually have very little impact on the usability of your app. However, if client-side expensive computations are a necessity - such as as nested loops - then it can have a substantial and blocking impact on your JavaScript's execution.
Algorithmic Complexity
Algorithmic complexity is often described using something known as Big O notation
(if that's something you're interested in learning more about take a look at this article by Sarah Chima). Reducing algorithmic complexity cuts out on computational baggage - unnecessary calculations/time spent in order to retrieve the same result.
Depending on the size of data you're working with, it can often be prudent to compare manipulation methods. Even if you're only saving a few milliseconds, if each operation is repeated potentially hundreds of time in a session, it could have a noticeable cumulative effect for the user. Perflink by Luke Jackson is a great website for analysing the performance of code blocks.
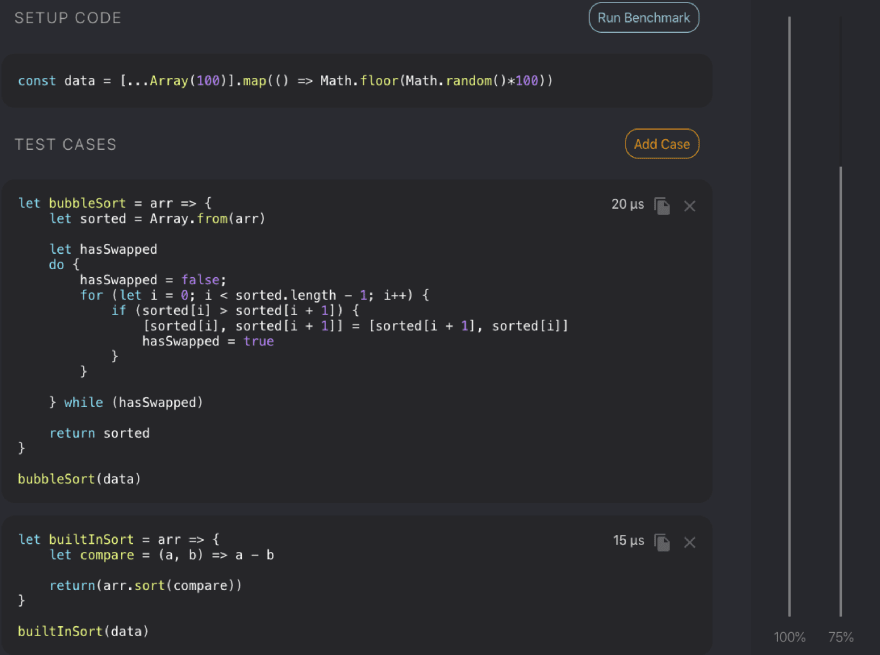
Perflink comparison of a bubble sort algorithm vs the JS built in numerical sort algorithm.
I don't want to focus on this section too heavily as (with UI-based JavaScript at least) there is little need to have heavy computational tasks running in the JavaScript browser thread that can't be handled elsewhere.
If gaining a deeper understanding of algorithms in JavaScript is something that does interest you - Bianca Gandolfo has a great talk in relation to it on Frontend Masters.
Memory Problems
Browsers are now excellent at performing optimised garbage collection. This means that things such as memory leaks unused event listeners are very rarely problematic as modern browsers now automatically remove the linked handler once the observed object becomes unreachable.
While the effects of memory problems and leaks are often negligible it is important to be aware of them, because in some circumstances they can cause massive performance problems. Seeing as the way in which memory is managed can vary so much per application, I think it is outside the scope of this overview. If memory problems are something you'd like to look into further Kayce Basques has written a great analysis on how to identify and fix memory problems.
Offloading Work
Well if we want our apps to be more performant we should just do less "stuff"... right? Any work that can be done prior to or in parallel to the client side script is often a no brainer for larger apps or apps where performance is key.
Web Workers
Leveraging Web Workers allow scripts to be run in background threads, relieving pressure from the main thread. While a worker can be slow to start, inter-thread communication is extremely quick. Their usage is still very much situational and they haven't as of yet received widespread adoption. James Milner has written a post about the performance of web workers and in what situations the trade off may be work it.
The JS main thread can spawn an unlimited number of web workers until the user's resources are fully consumed. A perfect example of a situation to use a Web Worker is an OffscreenCanvas, since canvas logic can often be computationally heavy it may be best to just offload it from the main thread entirely.
Chrome 80 has just added support for module workers. This mean that workers can now run with all the benefits of JS modules: dynamic import, parallel dependency loading, optimised execution etc. Since a lot of new JS is now being written as modules, it's nice for workers to have this functionality as well.
Worklets
Worklets are essentially lightweight versions of Web Workers that are restricted to performing specific functionality.
If your requirements are solve-able by one of the available Worklets, it may make sense to use one of them in place of a full-weight Worker.
Web API's
While Web API's have been mentioned above, they can also be utilised to offload work onto. There are a large number of Web API's available - they allow the task to be handled by the browser, while the JavaScript thread continues uninterrupted. Once the task has been completed, it may trigger a callback to re-enter the JavaScript thread.
For example, instead of writing a complex custom piece of logic store and retrieve data in client side JS, it might make more sense to interface with the IndexedDB API and abstract the logic and read/write performance.
Service Workers
Sharing some similarities to a Web Worker, a Service Worker is a script that runs in the background, separate from page. The main difference is that service workers are designed to be used as a proxy between the application and the network.
Due to their core usage being to interface with the network and modify responses, service workers are often talked about in conjunction with offline apps. Service workers are able to do this by utilising the Cache API in order to store and retrieve network requests and their associated responses.
In the context of performance; having specific network cache rules set up so that if the app is offline, or if the resource doesn't need to be re-fetched yet, means that the desired resource/content can be returned instantly from the cache without waiting on a network response.
The Offline Cookbook by Jake Archibald defines all of the different cache rules that can be used with service workers and the Cache API. Such as, whether the resource should always be returned from cache or whether it should prioritise the network but then fall back to the cache if unavailable.
SSR
If the app you're building is dependent on JavaScript performing updates to the DOM, then SSR can have a substantial effect on performance and initial load times. I wasn't sure what section to place this under as it has changes the way that both initial load and ongoing execution is performed in JS-based applications.
In a server side rendered app, pre-rendered HTML is downloaded by the client and can is viewable as soon as it is rendered by the browser, eliminating the need to wait for JS to be downloaded and executed before the user can view content. Amongst other things this helps with metrics such as Largest Contentful Paint.

Picture credit Alex Grigoryan
While SSR'd apps will still technically "work" and display content without the presence of JS, in order to have any sort of useful functionality JS is still required. The advantage being that the HTML and content can be rendered and displayed prior to downloading or executing the JS.
Most frameworks and UI libraries will expose utility functions to convert your app into static HTML on the server, which can then be hydrated on the client.
To improve this even further, the rendered HTML can be streamed to the browser in chunks, helping reduce the Time To First Byte (TTFB). In React, this is via the the renderToNodeStream method.
Renders
Nowadays devices are becoming available that have refresh rates as high as 120Hz. This means that to ensure a smooth/fluid UI experience, renders matter. This section is especially relevant if you're working with Component Driven Development where whole components are re-rendered as opposed to changes targeted at individual DOM nodes.
It's extremely common in modern (web app) development to experience situations where components render undesirably, often rendering more times than intended. This can have a knock-on effect to the children in the tree, meaning a top-level re-render not handled correctly **can cause every component in the app to render again, performing a lot of unnecessary render logic and DOM updates.
Speaking specifically in terms of React - Pure Components (or function components wrapped with React.memo) won't re-render unless their props change. In the world of hooks, helper methods such as React.useCallback and React.useMemo perform automatic memoization so that render items don't change unless they need to. Check out Andy Richardson's post on their benefits.
Why Did You Render is a super helpful package that you can plug into your React application and it'll thank you by giving you data about each of the component's renders, helping you to diagnose unnecessary ones. Eliminating unnecessary renders can alleviate resources to focus on renders that are needed, and have a beneficial effect on the user.

Picture credit why-did-you-render by Welldone Software
Performance Measuring
So you think you've made your app performant? Great! But how can you actually quantify that performance and monitor for improvements and impediments?
Performance measurements/metrics can be very subjective - partly in terms of whether you measure the app externals, or the resulting user- experience. Google has compiled a list of the user-centric metrics it considers to be the most important.
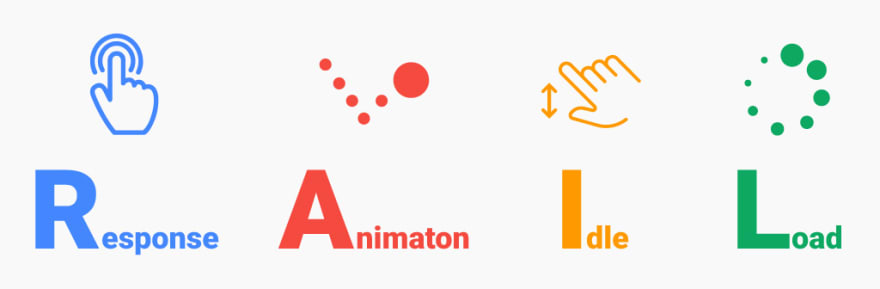
RAIL
The RAIL Model was coined by the Chrome team back in 2015; they refer to it as a user-centric performance model for that breaks down the user's experience into key actions. Goals of RAIL are all focused around user-centric metrics, measuring your app by user's perceptions of it.
Picture credit Sven Scheuermeier
Painting
Different metrics relating to how quickly a given web page paints its content so that it can be digested by a user of said web page. Google has been the main proprietor of Paint performance metrics (as with lots of other aspects of web performance. Thanks, Google!) and has introduced a number of different ones, all centred around the user. All paint metrics report on how quickly certain content is rendered and visible to a user.
- Largest Contentful Paint (LCP) - reports the time taken to render the largest content element that is visible in the users viewport. LCP is the most recent and recommended paint metric at the time of writing this post.
- First Contentful Paint (FCP) - this is the time taken to render any part of the page's content.
Using metrics such as these can give a great indication into how quickly a user can see the important content of the page. Being able to see content (and in the case of LCP, core content) more quickly will increase user satisfaction and reduce bounce rate.
Tools to Measure Performance
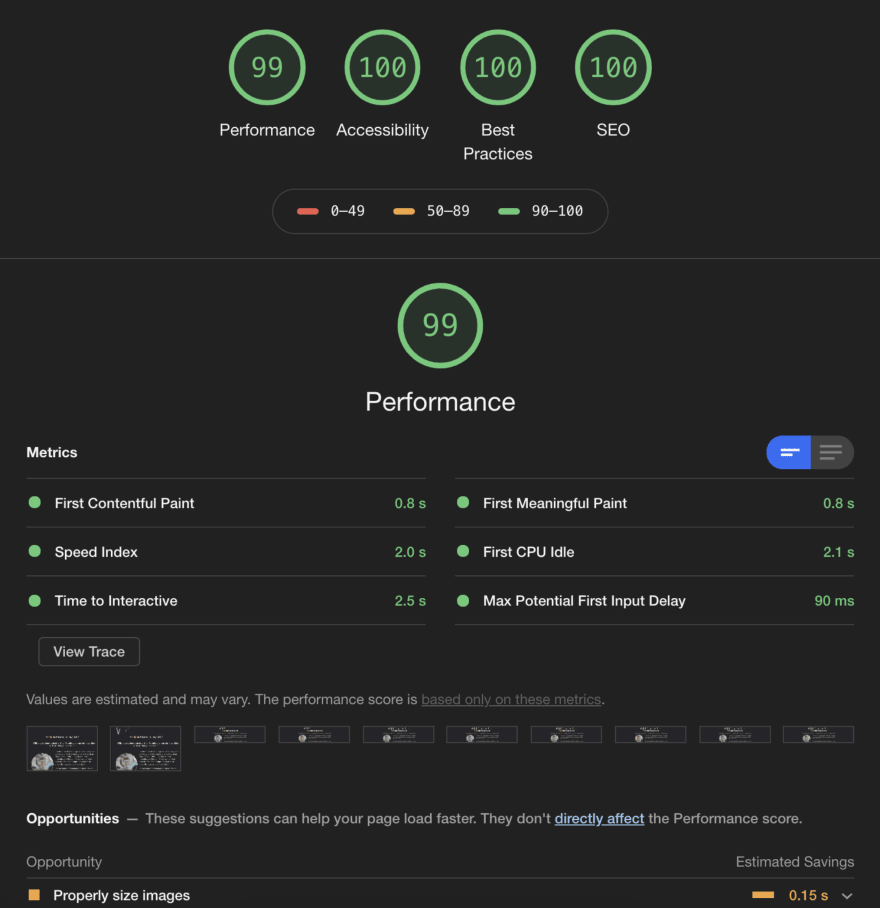
Lighthouse
Lighthouse is a great open-source tool that can be utilised in order to get a visual overview of a site's performance - it can be easily run against any site either using Chrome DevTools or via a Chrome Extension. A cut-down version of the Lighthouse test can be ran using Google's PageSpeed Insights that accepts any URL.
First Meaningful Paint (FMP) has been deprecated and will likely be replaced with LCP in newer versions of Lighthouse.
TimeToInteractive is a great metric to assess the performance of a web page as it measures the time required for a page to display useful content (FCP), register event handlers, and start responding to user interactions in a timely manner.
WebPageTest
WebPageTest is another service that you can use (for free) to perform analysis on any given website.
While the results and metrics are similar to those in Lighthouse, it's another great tool to use in order to get a breakdown of high-level performance.
Browser Profilers
All major browsers have profilers that allow you to record analyse the performance and responsiveness of a UI during a user session. These profiles are extremely detailed and allow you inspect (amongst other things) execution times, JS call stacks, paint metrics, and the content visible at any time during the session.

While the above image can be daunting to look at initially, knowing the basics of how to navigate it can really help when debugging performance issues.
In particular I'd like to draw your attention to what's known as a flame chart (the colourful midsection that almost looks like upside-down flames). The flame chart is essentially a depiction of the JS call stack over time and can provide you great insight into what might be under-performing or blocking the thread.
An anecdotal piece of advice I can give is that flame charts should ideally have very thin-tipped flames - meaning that while the call stack may be tall, each function call is executed quickly and doesn't block for long. If you have wide bars indicating slow function executions, looking at what function is the culprit may be a good starting point for improving performance.
For a less visual way of finding out what's taking a long time to run, you could also try and use the experimental Long Tasks API to identify tasks that block that main thread for 50ms or longer.
Monitoring Performance Over Time
Once you have an idea of your current app's performance, it can be important to keep track of performance over time. This is so that you can work on incremental improvements to your app, and be able to correlate those to changes in the performance of your app. For example, your LCP has just risen sharply - has there been a recent code change that could've caused the slowdown?
Usually you will hook up performance monitoring tools to your client-side JS so that they can run alongside your app and provide data to whatever logging or data visualisation tool you've chosen to use. One example of such a tool is perfume, which is both open-source and free to use.
There are many competing tools in this space, and I assume each of them will have their own advantages and disadvantages. It's important to evaluate the requirements of your app against the tool's offerings; keep in mind that seeing as these tools generally run on the client side JS, they themselves can actually have a negative (/blocking) performance impact.
Conclusion
Hopefully this has helped to give you a very high-level overview of why focussing effort on the performance of our apps is important, as well as outlining some suggestions and guidelines to keep in mind when trying to bolster performance.
There is a lot of information out there about the multitude of ways that performance is improved; starting small and incrementally setting new goals will help you to track progress and feel rewarded.
All resources used are mentioned/linked inline. Apologies for the mix of British and American spelling.

Top comments (0)