
This post was originally published on my blog: https://ambar.dev/kubernetes-liveness-probe.html
It was not very long ago when we were deploying individual services on each Virtual Machine. This process required the engineer in charge of the deployment process to be aware of all the machines where each service was deployed. Sure, people had built great solutions around this deployment model like tagging their EC2 machines with special names and using automation tools like Rundeck, Jenkins, etc., to automate the deployment process. Although this process had matured to a great extent over several years, it still had its shortcomings like -- random application crashes, inefficient deployment practices, poor resilience to failures, improper resource utilization, and bad practices around secret and configuration management.
The rise of Docker and Kubernetes
In order to solve the above-mentioned problems, people started building solutions around container environments like Docker and Kubernetes which not only solved the above-mentioned problems but also provided other benefits. One of the major benefits of using a platform like Kubernetes is that it provides self-healing capabilities to your application. According to the Kubernetes documentation, self-healing can be defined as:
Kubernetes restarts containers that fail, replaces containers, kills containers that don’t respond to your user-defined health check, and doesn’t advertise them to clients until they are ready to serve.
What this basically means is, if your application for some reason goes into a state where it cannot perform it's desired function, Kubernetes will try to replace the crashing instance with a new one until it succeeds. Well, how does Kubernetes know that a pod (A Pod is the basic execution unit of a Kubernetes application) is not in a healthy state, or whether it is ready to handle any extra workload at the moment? Kubernetes solves this problem with the help of health checks. Kubernetes has 2 types of health checks that it uses to determine the health of a running pod -- Liveness Probe and Readiness Probe. In this first part, we will take a look at how the liveness probe works and how we can use it to keep our applications healthy.
Liveness Probe

Developers and engineers often make mistakes. Sometimes, these mistakes don't get caught in our nightly or staging environments and might spill over to production. Often, these mistakes result in applications that get stuck in tricky situations and hence cannot perform their designated operations as usual. Sometimes, these corner cases can cause the application to crash during the most unexpected of circumstances when it is not possible for an engineer to take a look and correct it.

Some of the corner cases might include the following:
- An application not responding because of a deadlock
- Null Pointer Exceptions causing the application to crash
- Out of Memory (OOM) errors causing the application to crash
Often, applications stuck in these states need a restart to start functioning correctly again. The kubelet uses liveness probes to check if the application is alive and behaving correctly to know when to restart a container. Let us look at an example to see what parameters are involved in a liveness probe.
apiVersion: v1
kind: Pod
metadata:
  labels:
    test: liveness
  name: liveness-exec
spec:
  containers:
  - name: liveness
    image: k8s.gcr.io/busybox
    args:
    - /bin/sh
    - -c
    - touch /tmp/healthy; sleep 30; rm -rf /tmp/healthy; sleep 600
    livenessProbe:
      exec:
        command:
        - cat
        - /tmp/healthy
      initialDelaySeconds: 5
      periodSeconds: 5
If you look at the livenessProbe section of the yaml, you can see that the kubelet performs a cat operation on the /tmp/healthy file. If the file is present and the cat operation is successful, the command returns with exit status 0, and the kubelet considers the container to be in healthy state. On the other hand, if the command returns with a non zero exit status, kubelet kills the container and restarts it.
The initialDelaySeconds parameter tells the kubelet that it should wait for 5 seconds before performing the first liveness check. This ensures that the container is not considered to be in a crashing state when it is booting up. After the initial delay, the kubelet performs the liveness check every 5 seconds as defined by the periodSeconds field.
When the container starts, it executes the command touch /tmp/healthy; sleep 30; rm -rf /tmp/healthy; sleep 600 that can be divided into the following parts which are performed in the mentioned order:
- Create the file
/tmp/healthy - Go to sleep for 30s
- Delete the earlier created file
/tmp/healthy - Go to sleep for 600s
After the file /tmp/healthy is deleted, the liveness probe will start failing and the liveness probe will start returning an error code back to the kubelet. On detecting the failure, the kubelet will kill the existing container and replace it with a new one. The kubelet will keep doing this unless the liveness probe succeeds. You can run the command kubectl describe po liveness-exec to view the pod events.
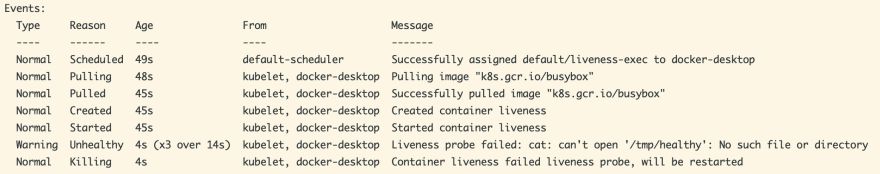
As you can see, when the kubelet found the pod to be unhealthy 3 consecutive times over a period of 14 seconds, it marked the pod as unhealthy and went ahead to restart it. Apart from generic commands, a Liveness probe can also be defined over TCP and HTTP endpoints which are especially helpful if you are developing web applications.
TCP liveness probe
apiVersion: v1
kind: Pod
metadata:
  name: goproxy
  labels:
    app: goproxy
spec:
  containers:
  - name: goproxy
    image: k8s.gcr.io/goproxy:0.1
    ports:
    - containerPort: 8080
    livenessProbe:
      tcpSocket:
        port: 8080
      initialDelaySeconds: 15
      periodSeconds: 20
This kind of liveness probe is basically a port check. If you want to check if a particular port on your web application is responsive or not, this is the way to go.
HTTP liveness probe
apiVersion: v1
kind: Pod
metadata:
  labels:
    test: liveness
  name: liveness-http
spec:
  containers:
  - name: liveness
    image: k8s.gcr.io/liveness
    args:
    - /server
    livenessProbe:
      httpGet:
        path: /healthz
        port: 8080
        httpHeaders:
        - name: Custom-Header
          value: Awesome
      initialDelaySeconds: 3
      periodSeconds: 3
For an HTTP liveness probe, kubelet polls the endpoint of the container as defined by the path and port parameters in the yaml. If the endpoint returns a success status code, the container is considered healthy.
Any code greater than or equal to 200 and less than 400 indicates success. Any other code indicates failure
Conclusion
In this post we saw what were the problems with the traditional approach to deploying and monitoring applications, what are the solutions that Docker and Kubernetes provide for handling the issues, and how the Liveness Probe helps resolve these issues. In the next post, we will take a look at the other kind of Kubernetes Health Check -- Readiness Probe. Stay healthy and stay tuned.

Happy Coding! Cheers :)

Oldest comments (2)
very useful ... check this tool github.com/alcideio/skan - it will tell you which deployments/pods/replicasets/... are missing those probes
Thanks for the great article! I like the introduction to Docker/Kubernetes and then the three types of liveness probes :)