
Most people think of GitHub as a code hosting and collaboration platform, but it can also be used as a data source for insights about software development. In this article, we will show you how to use MergeStat and MySQL to query GitHub data and extract valuable insights for developers and engineering leaders. We will start by getting data from a GitHub repo using MergeStat. Then, we will connect to a MySQL server with the MergeStat data using Arctype. Finally, we will explore the data and visualize it using some nifty graphs!
What can we learn by querying GitHub data?
Querying GitHub data with SQL can help us extract useful insights about our project and our team. Some use cases of visualized GitHub data include:
- Engineering metrics
- Code quality and pattern monitoring
- Software supply chain analytics
- Configuration and "infra-as-code" insights
- Audit and compliance
- Developer onboarding
- Vulnerability monitoring
In this article, I will show you how to get data from a GitHub repository using a tool called MergeStat and an experimental MySQL compatibility layer. MergeStat enables you to perform SQL queries on data in git repositories. Once we have MergeStat set up, we will connect to a MySQL server with a MergeStat backend using Arctype, which will allow us to visualize and explore data. Arctype is a database management and visualization tool that allows easy and effective management of data in your database.
Building and running the MergeStat application
Our first step to getting data from GitHub? Setting up MergeStat and its dependencies. The best way to install MergeStat's dependencies on your system is by building and running a Docker container locally.
Docker is a software platform that allows you to quickly build, test, and deploy applications. Docker provides you with the ability to package and run an application in a loosely isolated environment called a container.
Let us now build a container using Docker so that we can be able to run the MergeStat application on our system. You will need to download or clone MergeStat source code on GitHub to get started.
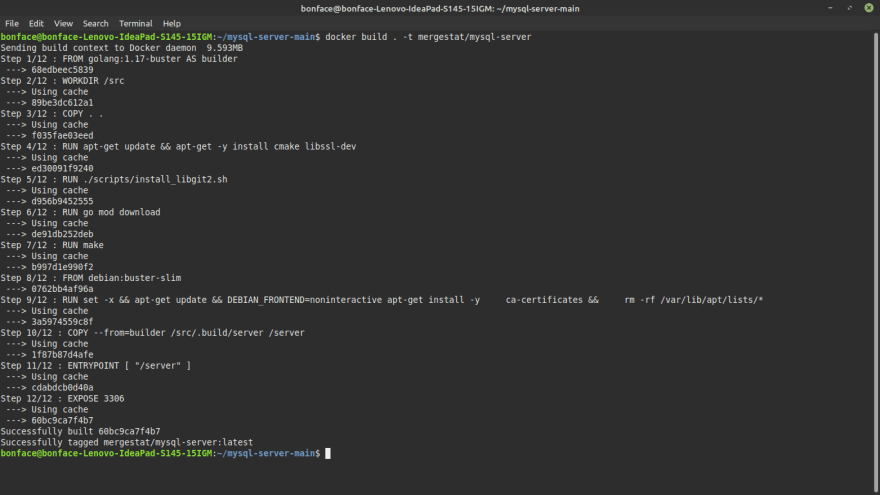
Open the folder with the source code using the terminal or command line. Then copy and paste the docker build command shown below in the terminal.
docker build . -t mergestat/mysql-server
Note that you need Docker installed in your system to run the Docker commands in your terminal.
Press enter to run the command. Your terminal should look like the one shown below.
Let's now run the docker run command so the MergeStat application can start running on our system. MergeStat will enable us to get data from GitHub and use MySQL and Arctype to view it.
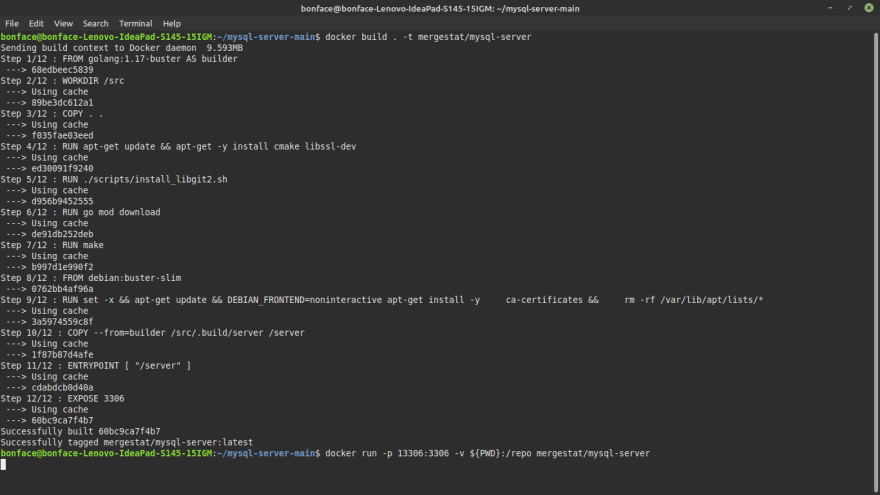
Copy and paste the docker run command shown below in the terminal and press enter.
docker run -p 13306:3306 -v ${PWD}:/repo mergestat/mysql-server
MergeStat is now running in your system, as shown below.
Getting GitHub repo data and visualizing it
We will use Arctype to view data on a GitHub repo. You can download the Arctype app to connect to this local database. Also, make sure you have a MySQL database installed in your system.

You will need to add your database credentials. In our case, select MySQL. You can fill in the credentials using the following information:
- Name: enter any name that you want
-
Host: enter
127.0.0.1 -
Port: enter
13306 -
User: enter
root -
Password: enter
root - Database: enter the URL of the GitHub repo that you want to study
The credentials should look as shown below:

After entering the credentials, press the "Test Connection" button at the bottom right of your screen to be sure that everything works. Then save the connection.
Once MySQL and Arctype have successfully connected, you can create a new query by clicking the + button, as highlighted below.

Run the query below to see all commits in your GitHub repo. Don’t forget to name your query and save it to access it later.
select * from commits
After running the query, you should have something like shown below.

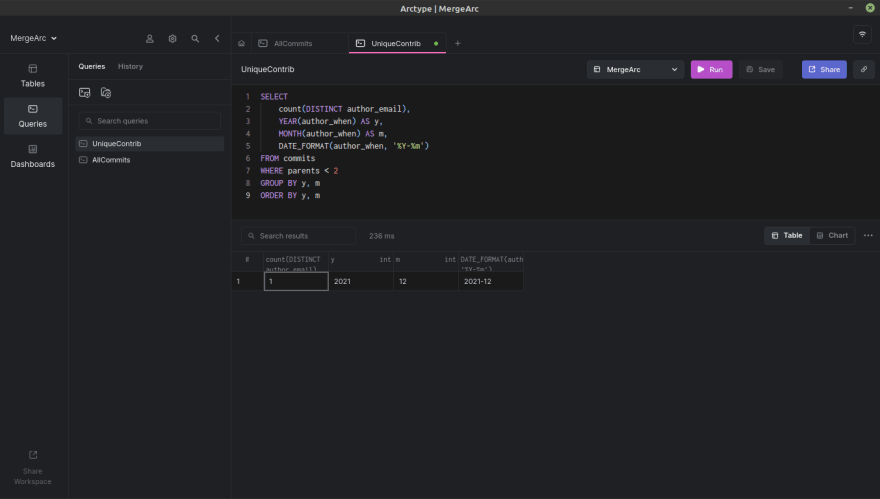
Let us now create and run a query that produces a chart of unique contributors every month by author_email. Here is what the query will look like.
SELECT
    count(DISTINCT author_email),
    YEAR(author_when) AS y,
    MONTH(author_when) AS m,
    DATE_FORMAT(author_when, '%Y-%m')
FROM commits
WHERE parents < 2
GROUP BY y, m
ORDER BY y, m
After running the query, you should have something like the result shown below.
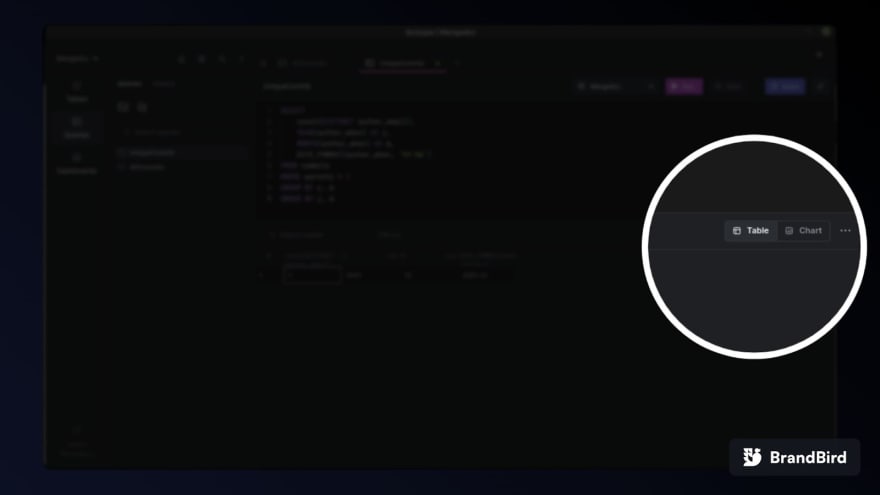
We will now use the table we just created to come up with a chart. On the top right corner of the table, you have "Table" and "Chart" options—select "Chart," as shown below.
You can select any chart type on the right side of your screen. In our case, we will choose a bar chart.
Place DATE FORMAT on the X-axis and count, y, and m on the Y-axis. You will then come up with a chart as shown below. Yours will look different and will depend on the data you are working with, of course.

Author by number of commits per month and year
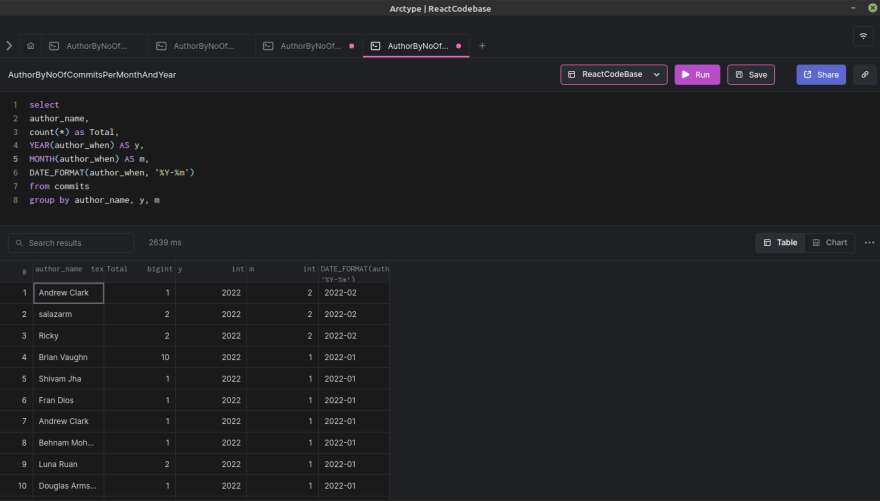
Let's now create a bar chart that shows how many commits one person has made in a GitHub repository. For this example, we will use the React Codebase repository on GitHub.
First, create a new workspace on Arctype (as explained in the section above) and name it ReactCodeBase. Then, connect to MySQL and enter the credentials below.
-
Name: enter
ReactCodeBase -
Host: enter
127.0.0.1 -
Port: enter
13306 -
User: enter
root -
Password: enter
root -
Database: enter
https://github.com/facebook/react
Run the query below in Arctype (and don’t forget to save it).
select
author_name,
count(*) as Total,
YEAR(author_when) AS y,
MONTH(author_when) AS m,
DATE_FORMAT(author_when, '%Y-%m')
from commits
group by author_name, y, m
You can then come up with a table and chart like the one shown below. Feel free to configure your chart as you please.

Top 10 contributors
In this example, we will create and run a query that creates a table and a chart of the top 10 contributors to a GitHub repository. We'll still be using the React Codebase repository.
Run the query below in Arctype and save it.
SELECT
author_name,
Count(author_name) AS TotalCommits FROM commits
GROUP BY author_name ORDER BY TotalCommits DESC LIMIT 10;
You can come up with a table and chart that look like the ones shown below.


Conclusion
Now that you know how to get data from a GitHub repo and visualize it, you can decide to create and run all kinds of SQL queries to obtain valuable insights about your project. From engineering metrics to fun stats about your top contributors, you'll be able to learn more about your code than you previously thought possible. The sky is the limit!

Latest comments (0)