
The goal of every business is to perform efficiently, maximize profit and make strategically-guided decisions. In the current business world, the competition is high and every business needs every edge and advantage they can get to improve their odds of success.
Companies that want to stay in business and thrive in the current business world must employ data analysis. Data analysis plays a role in making decisions more scientific and helping businesses operate more effectively.
What is Data Analysis?
Data analysis can be described as the process of cleaning, transforming, and processing raw data to extract actionable and relevant information that helps businesses make informed decisions. The process of data analysis provides useful insights and statistics that can be presented in tables, charts, and graphs.
In this article, you will learn how to get useful information from a collection of data by running SQL queries. Also, you will learn how to present that information using graphs and charts. I will be using a dataset of different stores of a supermarket company, PostgreSQL, and the Arctype SQL client.
What is PostgreSQL and Arctype?
PostgreSQL, also known as Postgres, is a free and open-source relational database management system. Arctype is a fast and easy-to-use database management tool for writing SQL queries, building dashboards, and sharing data with your team.
Setting Up PostgreSQL
To use Postgres in this tutorial, navigate to the Postgres download page and download it for your operating system. It is available for Linux, macOS, and Windows.
After installing Postgres on your machine, run the command below to confirm the installation.
psql --version
You should be able to see the version of Postgres installed into your system. Now run the command shown below to open the Postgres prompt.
sudo -u postgres psql postgres
Once Postgres has opened on the command line, run the command below to set a password for postgres.
\password postgres
To quit the Postgres prompt, run the command shown below.
\q
Let us now create a database called “supermarket” in PostgreSQL that will be used to store data from the supermarket stores CSV file. We run the command below.
CREATE DATABASE supermarket;
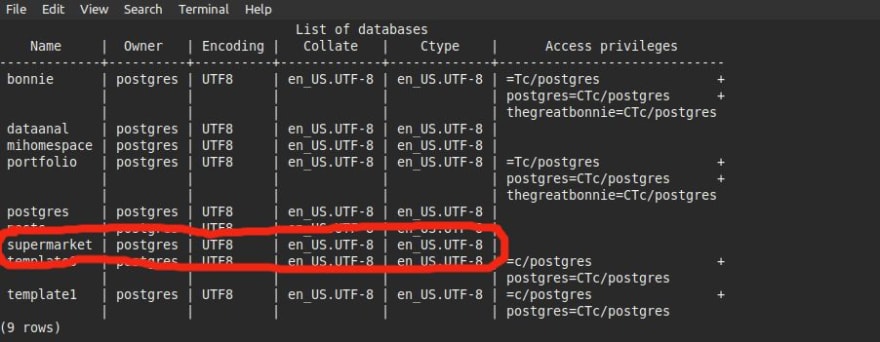
Then run the command shown below to see if the database you created is on the list of databases in Postgres.
\l
As you can see from the screenshot below, the supermarket database was created in PostgreSQL.
The Arctype SQL Client
To use Arctype, navigate to the Arctype homepage and download the Arctype app on your machine. The application is available on Windows, MacOS, and Linux.

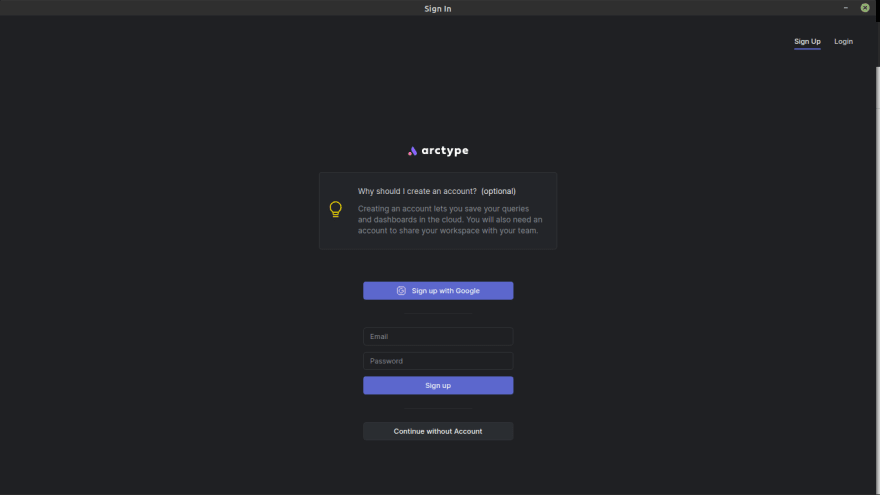
Once the app has been installed, open it and you will be prompted to create an account as shown below.
Integrating the Arctype SQL Client With Postgres
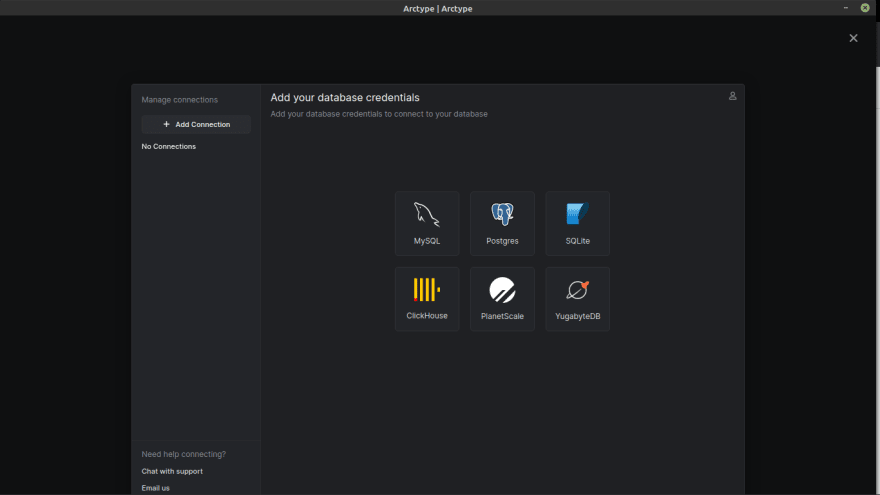
Once you have created an account, you will be prompted to select your database. In this case, select Postgres.
The next step is to add Postgres credentials to connect Arctype to your Postgres database.

Fill in the fields according to the example shown below.
- Name: Supermarkets Dataset
- Host: 127.0.0.1
- Port: 5432
- User: postgres
- Password: Postgres password
- Database: supermarket
Note: Use the credentials you created when creating a database in the Postgres prompt.
Once you have entered the Postgres credentials, click the “Test Connection” button at the bottom to make sure credentials are correct. If the credentials are correct, click the “save” button to the right of the “Test Connection” button to complete Postgres and Arctype SQL client integration as shown below.

Importing CSV Files Into Postgres Using Arctype
We will be importing the supermarkets stores dataset CSV file that you can download by navigating to this Kaggle web page as shown below.

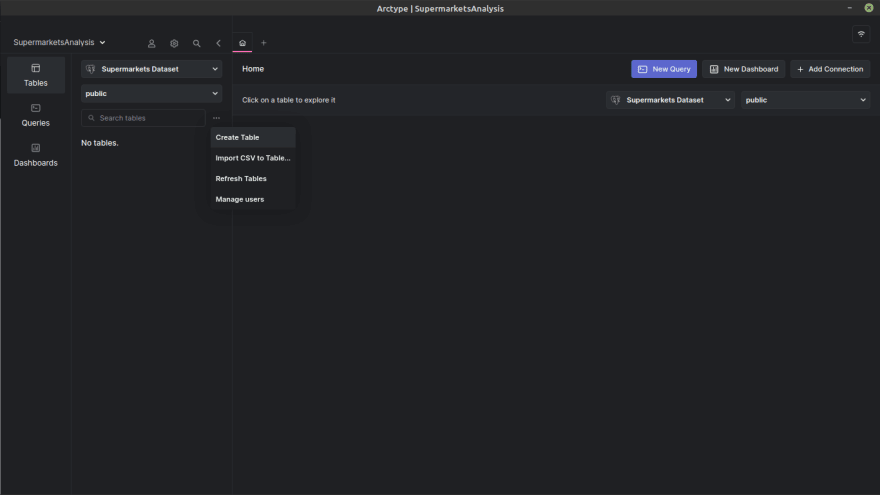
To import the CSV file into Postgres using Arctype, navigate to the “Tables” view. Click on the three dots next to the table search field. Then select “Import CSV to Table” as shown below.
Next use the file selection window that appears to select the CSV file you downloaded. Select your file and click the “Open” button as shown below.

Once you have selected and opened the CSV file, Arctype will display the first ten rows of the CSV file data for preview. If everything looks correct, click the “Accept” button as shown below.

After clicking the “Accept” button, you will be redirected to a configuration window as shown below. The window allows you to determine where you want the data to be stored and to select the schema.

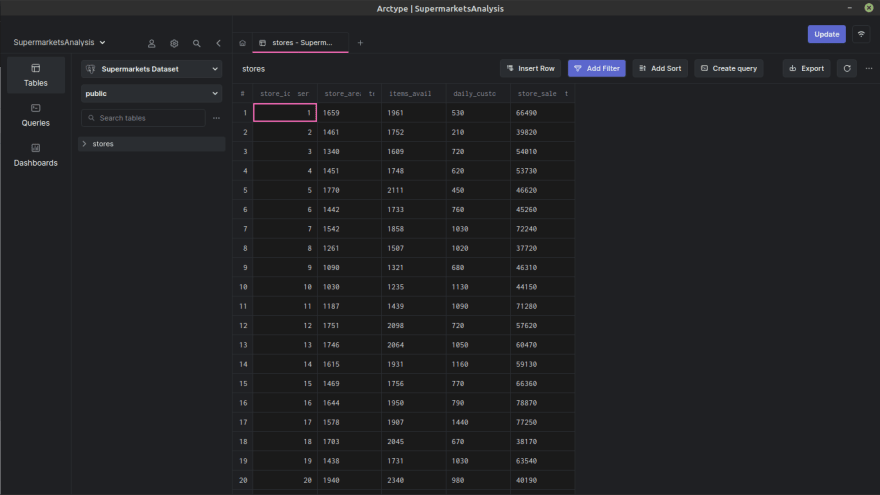
If everything looks good, click the “Import CSV” button to start importing your CSV file. Open the table data was successfully imported,everything should look as shown below.
Running SQL Queries With Arctype
SQL queries allow you to display or modify data from databases. In this section, I will show you some queries you can run to create tables, charts or graphs to visualize the supermarkets data.
Let us assume you are the owner of the supermarkets. You would want to know interesting stats such as the top 10 performing stores by sales. To get such insights, you can run a SQL query that creates a table of top ten performing stores. Then you can visualize the data by creating a graph or a chart.
To run a SQL query using Arctype, click the “Create query” button on the top right of the Arctype window. A screen will then appear where you can run a query as shown below.

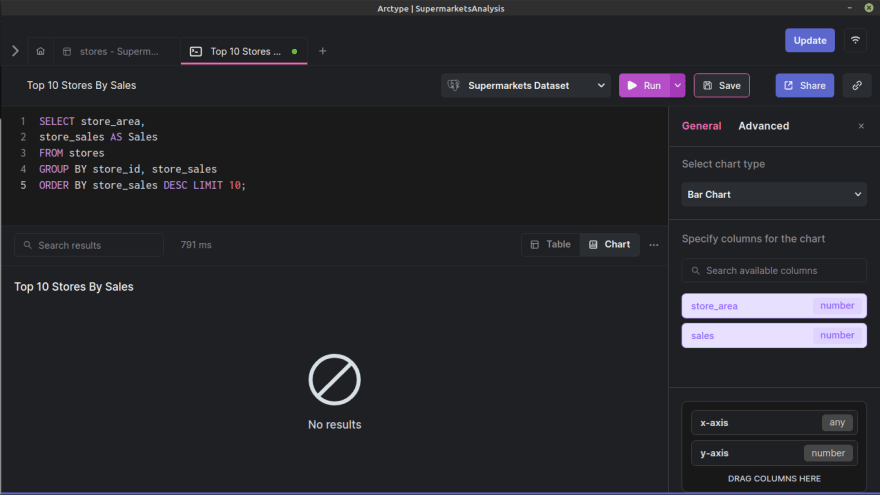
Give your query a descriptive name like “Top 10 Stores By Sales.” Then write the following SQL query to determine the top 10 stores by sales from the stores data.
SELECT store_area, store_sales AS Sales FROM stores GROUP BY store_id, store_sales ORDER BY store_sales DESC LIMIT 10;
The query selects data in the column store_area and store_sales from the stores table where store_sales is renamed to Sales. The data then gets grouped by the columns named store_id and store_sales (Sales.) After that, the data is ordered by store_sales where sales are arranged from highest to lowest. The query limits the results to the top 10 selling store areas.
If everything goes well, the query should create a table with two columns named store_area and sales as shown below.

Creating Charts Using Arctype
Let us now create a chart from the table created by the SQL query. To create a chart using Arctype, select the “Chart” option at the bottom right of the SQL editor as shown below.
On the right side of the screen, you can select the type of chart you want. In this case, we select “Bar Chart.” Then below the “Select Chart Type” option, you have the “Specify Columns For The Chart” option. In this section, drag the store_area column to the X-axis column and the sales column to the Y-axis column. Arctype should help you come up with a chart similar to the one shown below.

Conclusion
In this article, you have learned how to create a database in PostgreSQL, import a CSV file into the DBMS and how to run SQL queries to analyse data. Now, I suggest you try to create different SQL queries to come up with some more exciting insights and use Arctype to create charts.

Top comments (0)