
When accepting payments online through Stripe, the built-in tools will be adequate to understand how your business is doing. At first.
But Stripe Dashboard has some limitations:
- There is no way of querying data and visualizing the results.
- Stripe Sigma allows you to build custom queries using SQL and comes up with some very helpful report templates with some important exceptions like Monthly Recurring Revenue (MRR).
- Stripe Sigma data always has a 24-hour lag.
- You can’t access the underlying database Stripe Sigma runs on. This makes it impossible to overlay payment data with weekly active users, uptime, or any other important operational metric.
You can overcome all these limitations by loading your Stripe data to a database that you have control of where you can make queries. There you can build more advanced charts and graphs that show the performance of the business.
In this article, I will guide you step by step on how to load Stripe data to a database, query it, and build dashboards with Arctype.
Integrating Stitch data with Stripe
To load Stripe data into Postgres, you can use platforms such as Stitch Data and Rudderstack. In this guide, we will use Stitch Data because it is a cheap and a fast solution.
Once Stripe data is loaded to Postgres, we will connect it to Arctype to visualize the data. Arctype is a SQL client and database management tool that you can use to build beautiful charts in two clicks and combine multiple charts in a Dashboard.
First, visit the Stitch website and on the homepage you can sign into your account if you already have one.

If you don’t have an account, click ‘Sign up free’ button and you will be redirected to a page to set up an account. There is a free trial where you can make sure the service is a good fit.
After setting up an account, the next step is adding an integration. According to Stitch data, integrations are apps and databases that you can use to send data through your pipeline.
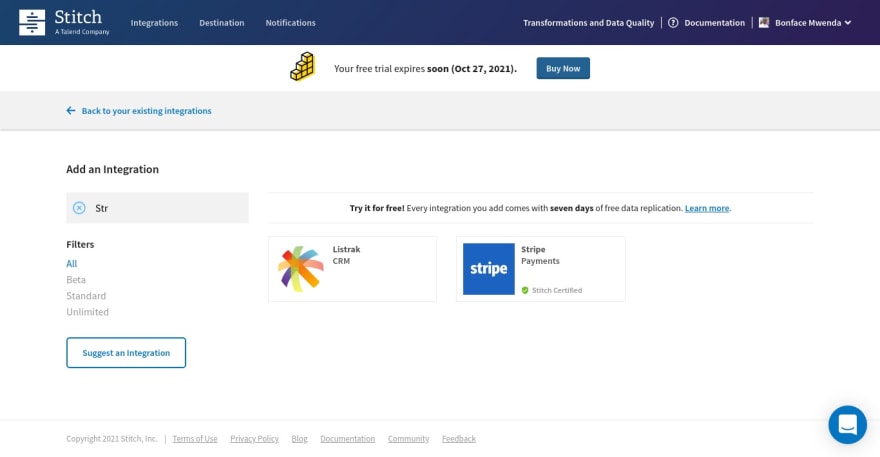
In this case, Stripe is what you will be adding as an integration. On the integration pag there is a table of different apps and databases you can choose from. On the left side of the page, there is a search bar. Start typing Stripe and it will appear on the list where you can select it as your integration.
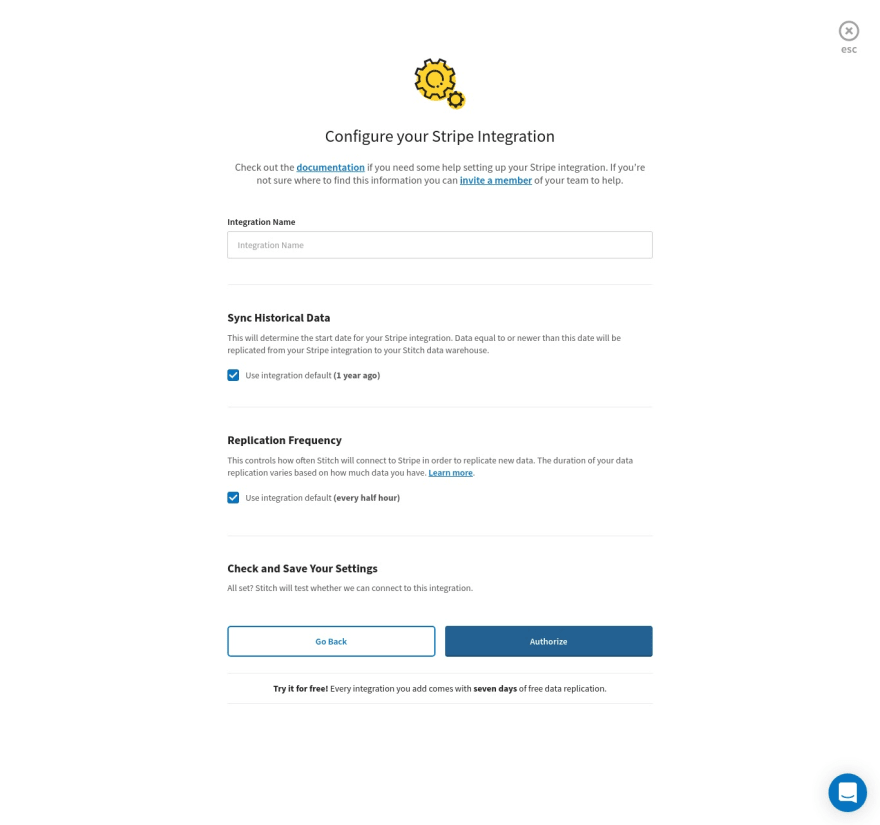
Once you select Stripe as your integration, you will be redirected to a page to configure your Stripe integration. Add the integration name of your choice. Then scroll down the page and click the authorize button.
You will be redirected to Stripe to connect your account with Stitch data. Select the account you want to connect to Stitch. This will enable Stitch to see your account data such as all payment and payout history. Click the ‘connect’ button to complete the connection.

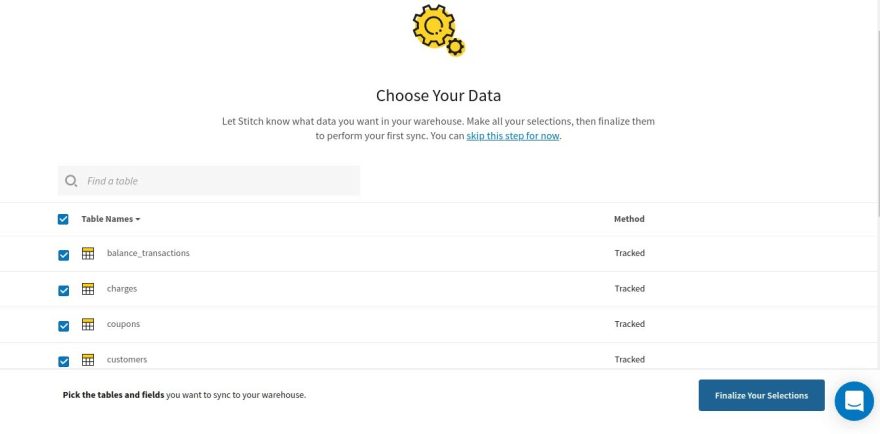
After that, you will be redirected back to Stitch to choose the Stripe data that you want stored in Postgres. If you don’t know which data to choose, click the ‘Table Names’ drop down menu at the top and select all tables. Then click ‘Finalize your selections’ button at the bottom right of the page.
You will be directed to a page that shows that your Stripe integration has been successful. Click the ‘All Done’ button to complete the integration process. Learn more here on how to connect Stitch Data with Stripe.
Adding Postgres as your data destination
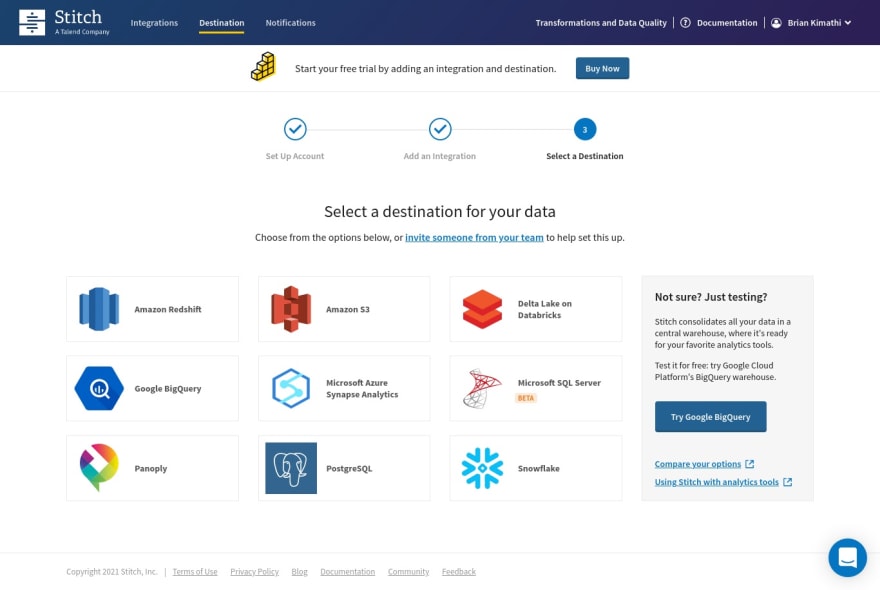
Once you have connected Stripe with Stitch, the next step is adding a data destination. In this case, your data destination will be Postgres. On the Stitch dashboard, go to the ‘Select a Destination’ section. Select Postgres from the options as a destination for your Stripe data.
You will then be directed to a page where you tell Stitch Data how you want to connect to your database.
On this page, you are required to fill in a display name that helps distinguish various connections of the same type. You are also required to add description, which is optional, host (Endpoint), port, username, password and Database name. Check the documentation here to learn more on how to connect PostgreSQL with Stitch Data.
Loading Data Into Postgres
Once Postgres is connected to Stitch, on Stitch dashboard, click the ‘Integrations’ section and select the name you gave your integration connection at the bottom of the page.
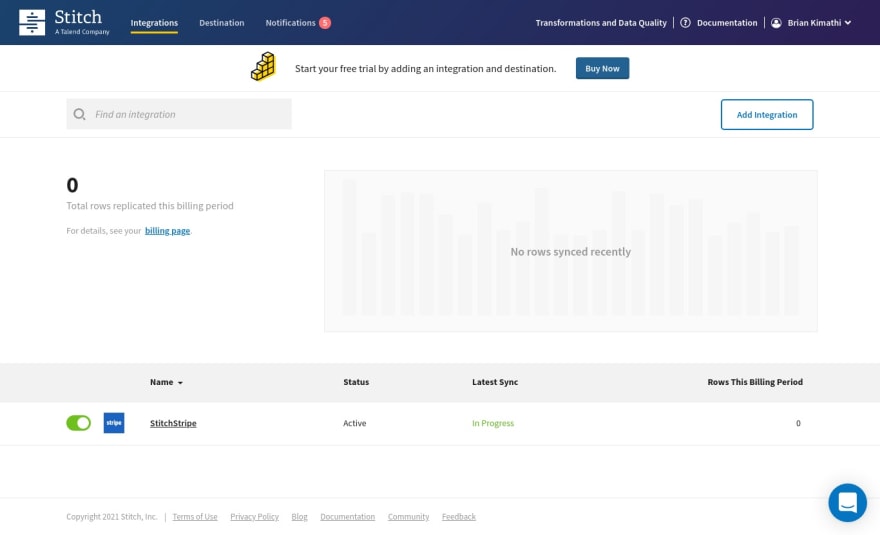
Next you will be directed to the dashboard of your integration. In section below the Integration name, click ‘Extractions’ option where you will be redirected to the extraction page where you can extract your Stripe data and load it to Postgres.
Click the ‘Run Extraction Now’ button on the right side of the page to extract the Stripe data and wait until the extraction process is completed.

With Stripe data loaded to Postgres, the next step is connecting Postgres to Arctype to visualize the data. You can run some queries to create tables, charts and graphs.
Connecting Postgres to Arctype
You need to create a new workspace first to connect Postgres to Arctype. A workspace is a defined space for a given project. Enter workspace name of your choice and click ‘CREATE WORKSPACE’ button.

Once your workspace is created, you will see a list of connection types. Select Postgres as your connection. The next step is filling in Postgres credentials. Once you are done, test your connection and save.

Once the connection is successful, you will be directed to your workspace where you can visualize data in your Postgres database. Here you can run queries, create charts and Dashboards.
On the top left side of your workspace, select tables. On the right side of the tables, select the connection name from the drop down menu.
Below the connection, select the display name of your data destination that you added in Stitch when you were connecting Stitch to Postgres from the drop down menu.
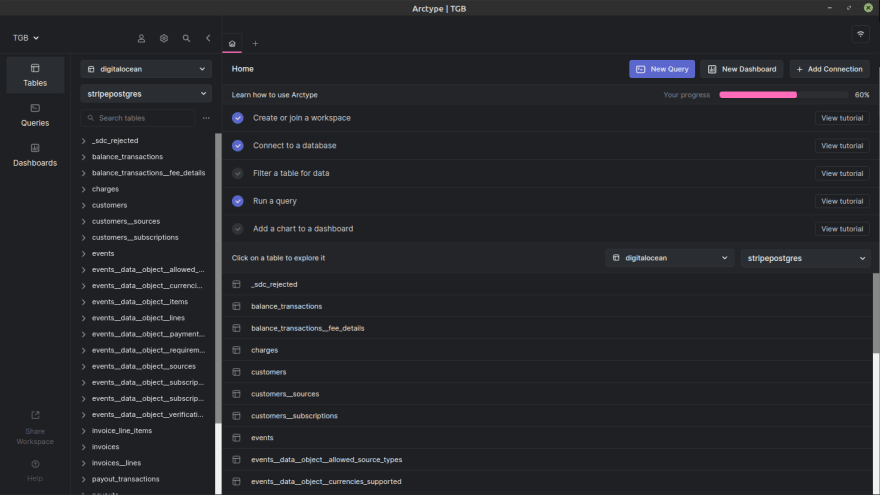
You can search tables you want to visualize, edit, insert row, add filter, add sort, create query or export
Querying your Stripe Data in Postgres
Queries allow you to display or modify data from databases and in this article, I will show you some queries you can run to create tables, charts and dashboards to visualize Stripe data.
Let say you have a business that uses a subscription business model and you have three products or plans.
- Basic Plan.
- Premium plan.
- Business plan
Some important stats you would want to get from your Stripe data is:
- Number of customers that have subscribed to each plan or product.
- Revenue from each plan or product.
Customers by Product
Select subscriptions table from the schema that contains your Stripe data on Postgres. You can find tables on the left side of your screen.

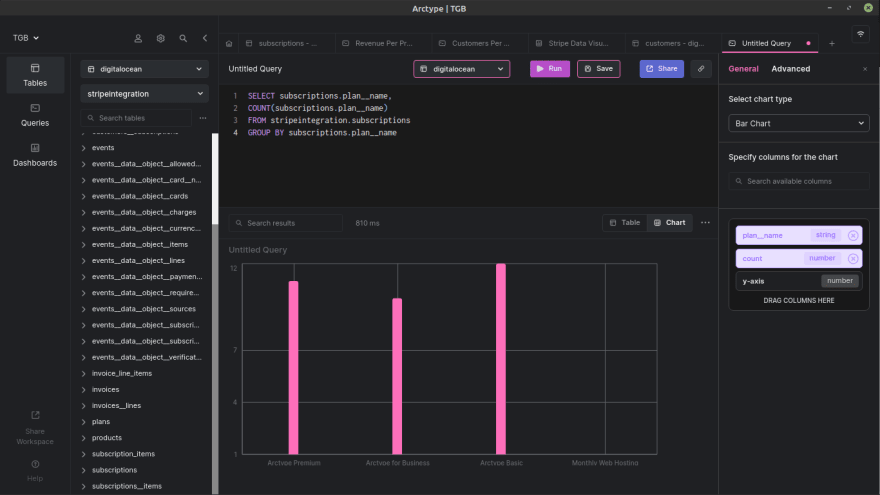
Click the ‘Create query’ button on top right of the screen and the screen below will appear where you can run a query. I like to save my queries with a descriptive name like ‘Customers Per Product’. Then write the following SQL query and click the run button at the top.
SELECT subscriptions.plan__name,
COUNT(subscriptions.plan__name)
FROM stripeintegration.subscriptions
GROUP BY subscriptions.plan__name
After running the query, a table is created and you can use it to create a chart. Don’t forget to save your query by clicking the save button at the top right side of the screen.

To create a chart you need to select the ‘Chart’ button on the middle right side of the screen. On the right side, drag the columns against the y-axis and x-axis. In this case, drag the plan__name column and place it on the x-axis. Then drag the count column and place it on the y-axis to compare the number of subscriptions by plan.
Click the ‘Advanced’ option on the top left side of the screen to modify the chart. Here you can add chart title, x-axis title, vertical x-axis label, y-axis title, x-axis range and y-axis range.
Revenue By Product
Follow the steps on Customers Per Product Query above and run the following SQL query.
SELECT subscriptions.plan__name,
subscriptions.plan__amount * COUNT(subscriptions.plan__name) AS product_revenue
FROM stripeintegration.subscriptions
GROUP BY subscriptions.plan__name, subscriptions.plan__amount
You should come up with something like this below.

Creating a Dashboard
Dashboards are an excellent tool to maintain charts and tables that let you analyze your data. Click the + button on the top left of the screen to create a dashboard. Add the name of the dashboard and click the create button.

Adding a Table to Your Dashboard
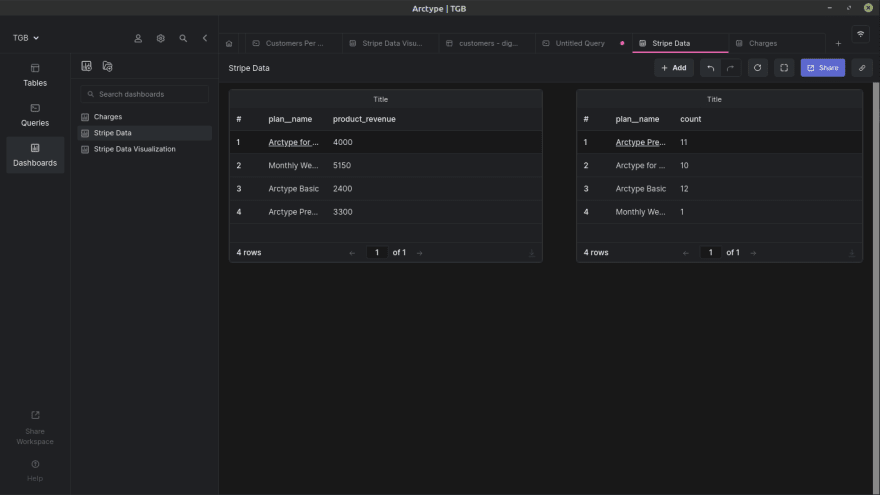
Click the add button on the top right side of the dashboard. On the drop down menu, select the table. Click the pink ‘Select table data’ button on the dashboard. From the menu, select one of the tables, like subscriptions that were created when you run Customers per product query and Revenue per product query.

After you have added one of the tables, repeat the same procedure of adding a table to a dashboard to add the other table. You should come up with something like this.
Adding a Chart to Your Dashboard
On the top left side of your screen click ‘Queries’. Then select ‘Revenue Per Product Query’ or ‘Customers Per Product Query’. Click the overflow menu on the top right side of the chart. Then click ‘Add Chart to Dashboard’ from the menu to add your charts directly to the Dashboard.
Select the dashboard you want to add your chart to. Below is how your dashboard should look like with Tables and Charts.
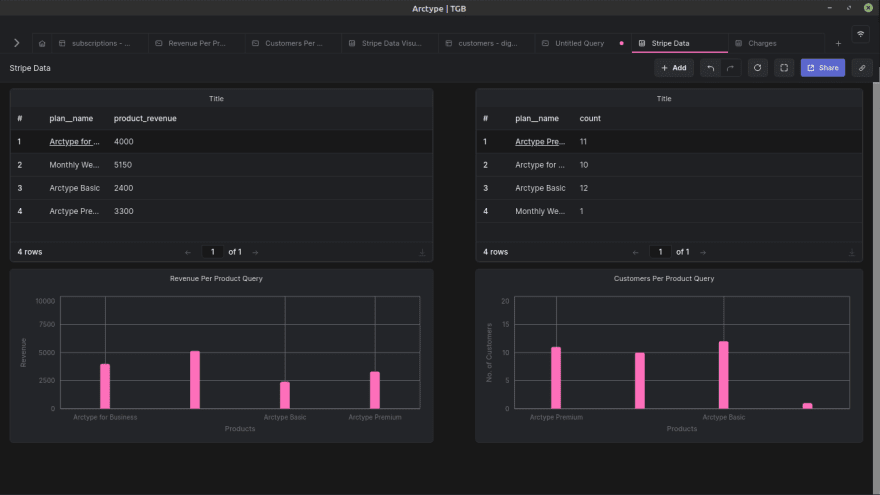
Now you are really up to date on your business!
Conclusion
Loading Stripe data to a database gives you freedom to run SQL queries that help display interesting and important metrics of your business that Stripe dashboard doesn’t provide. From here you can mix and match Stripe data to event data from your applications, correlate new tranches of users with higher revenue, and fully understand the impact of each change on your bottom line.

Latest comments (0)