
SQL is a powerful language that provides a deep understanding of what can and cannot be done with data. SQL excels at bringing order to disorganized, large data sets and helps you discover how distinct data sets are related. Spark is an open-source analytics engine for processing large amounts of data (what you might call “big data”).
It allows us to maximize distributed computing when carrying out time-intensive operations on lots of data, or even when building ML models. PySpark is a Python application programming interface that allows us to use Apache Spark in Python. Querying SQL databases with PySpark thus lets us take advantage of Spark’s implicit data parallelism and fault tolerance from a Python interface. This gives us the ability to process large quantities of data quickly.
Prerequisites
Before proceeding in this article, you should be able to check the following boxes:
- Know how to set up a Python environment
- Know how to use a command line
- Have admin access to edit windows environment variables
If you can handle all of the above, you’re in the right place!
Setting up PostgreSQL
PostgreSQL is a free and advanced database system with the capacity to handle a lot of data. It’s available for very large data in several forms like Greenplum and Redshift on Amazon. It is open source and is managed by an organized and very principled community.
Why PostgreSQL?
PostgreSQL is widely used for analytics and data mining, and getting help is relatively easy as there is an existing community. Also, its SQL implementation is very similar to ANSI standards. Most web application developers also prefer to use it, including those that work with popular web frameworks like Django and Ruby on Rails.
Step by step installation guide for Postgres
For Windows, I advise using the installer provided by EnterpriseDB. It supports PostgreSQL, pgAdmin, and Stack Builder (from EnterpriseDB, which installs the spatial database extension and other relevant tools).
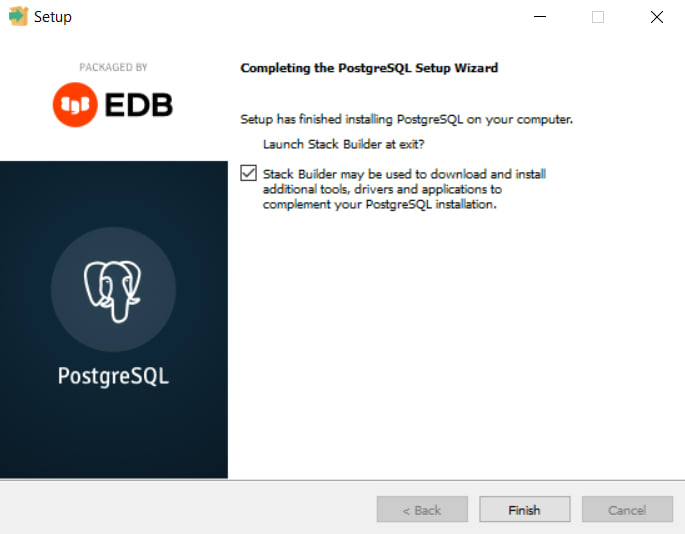
When the installation is completed, the window below is displayed. Here, an option to launch Stack Builder is seen. Make sure the checkbox is ticked and click “Finish.”
When Stack Builder launches, navigate to the drop-down menu and select the PostgreSQL installation. Click “Next.”

A list of applications to be installed is displayed on the next window. Expand Spatial Extensions and check the box for the PostGIS bundle for the Postgres version you downloaded. Next, navigate to “Add-ons, tools, and utilities” and select the latest EDB language pack. This provides support for programming languages, including Python.

Click “Next” over the next couple of windows and then wait for the installation files to download completely. When this happens, the window below comes up. Leave the “Skip installation” box unchecked and click “Next.”

Follow the instructions on the following windows to install the EDB language pack. If asked for your database password, enter the password that was set. Also, answer “Yes” every time a window pops up about setting environment variables.
When finished, a folder containing shortcuts and links to the PostgreSQL documentation should be on your Windows Start menu.
Configuring a SQL Client
You can use any SQL client to follow the rest of this tutorial but we will be using Arctype. We will create the database and import CSV data which we will then write queries against using PySpark.
Connecting PostgreSQL with Arctype
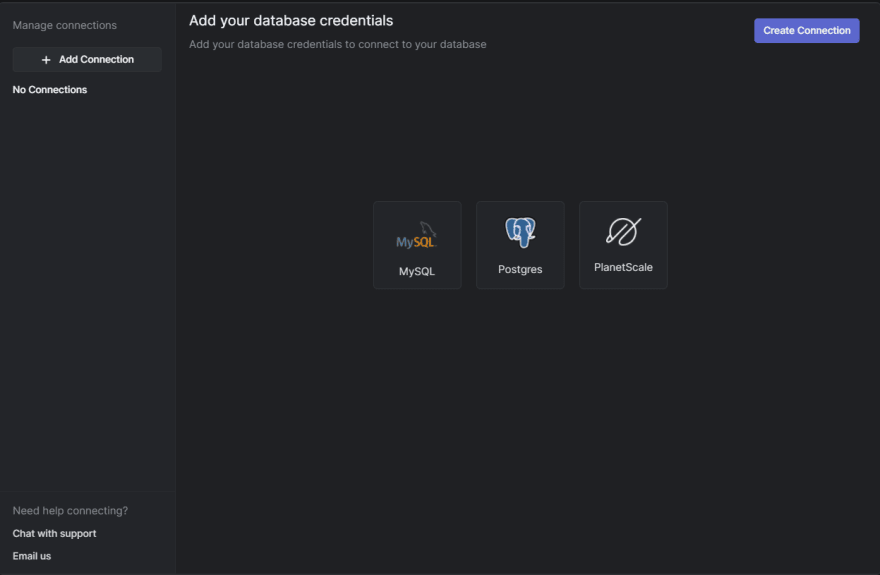
The next step is to connect your database with Arctype. Currently, MySQL, Postgres, and PlanetScale are supported. As you may have figured, you will be using Postgres, so click the Postgres button. The window below gets displayed.

Enter a name for the connection if you are not fine with the default. Next, enter the username and password you defined for your database under “User” and “Password,” respectively. Finally, enter the name of the default database and click “Test connection.”
You should get a response stating that the test was successful. Once this is done, click “Save.”

Importing data into the database
First write a query to establish the database: CREATE DATABASE analysis. To test SQL queries, let's first import our data. To start with, select the “Tables” option on the left menu. Next, click the ellipsis to the right of the “search tables” field and select the “Import CSV to Table” option.

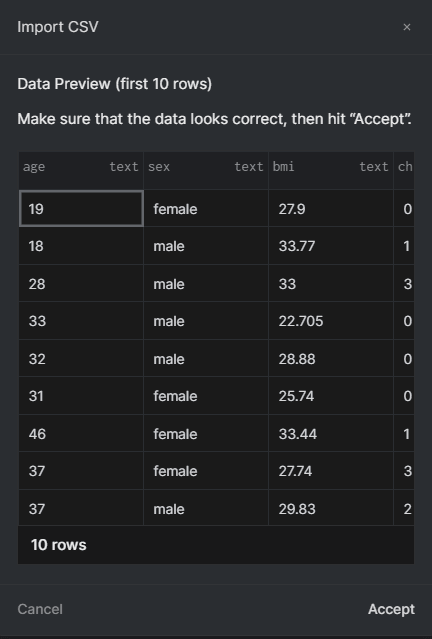
Next, navigate through your directory manager and select the file you wish to open. A preview of the CSV file’s content gets displayed, as shown below. Click accept if all things look as they should be.
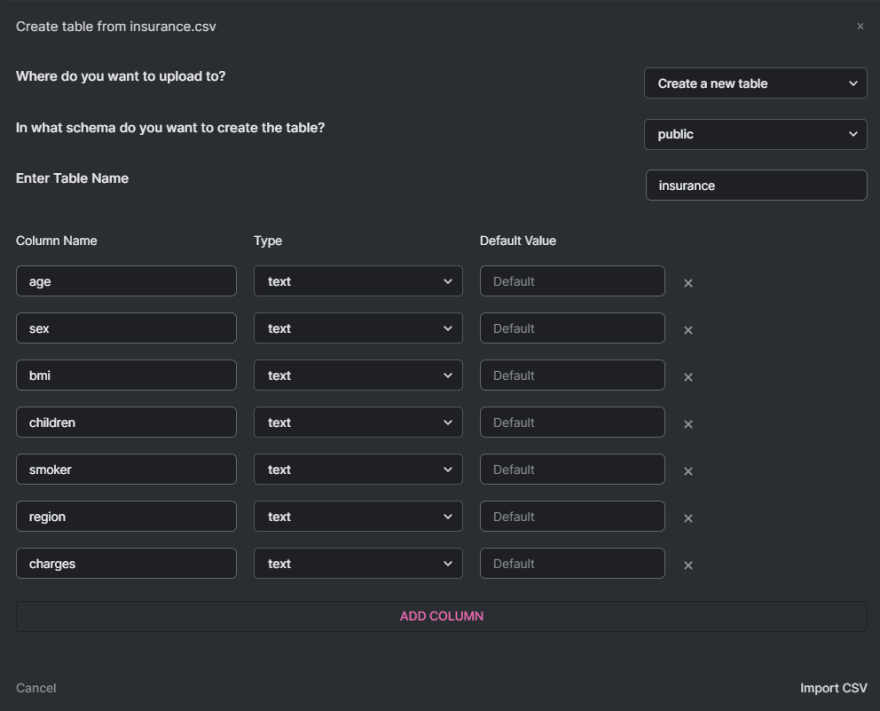
The window below appears. Change the name of the table if you deem it fit and click “Import CSV” on the bottom right of the window.
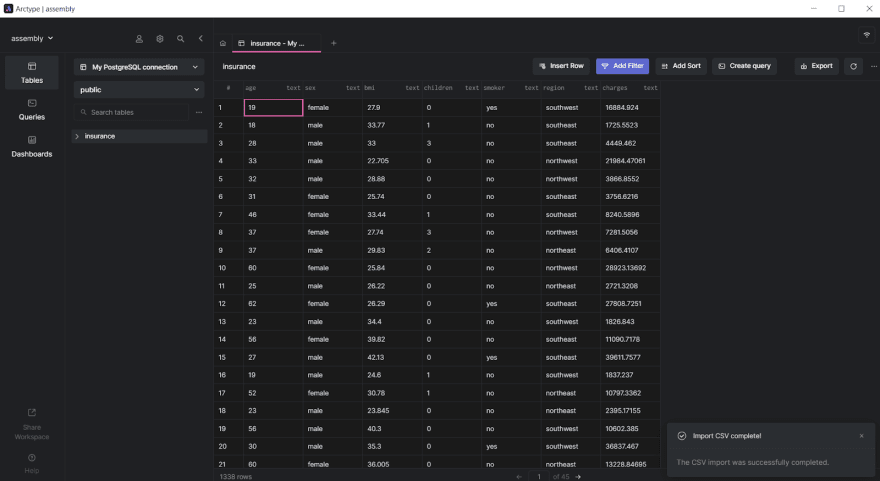
Voila! As seen below, your CSV file and the corresponding data are now imported.
Visualizing your data
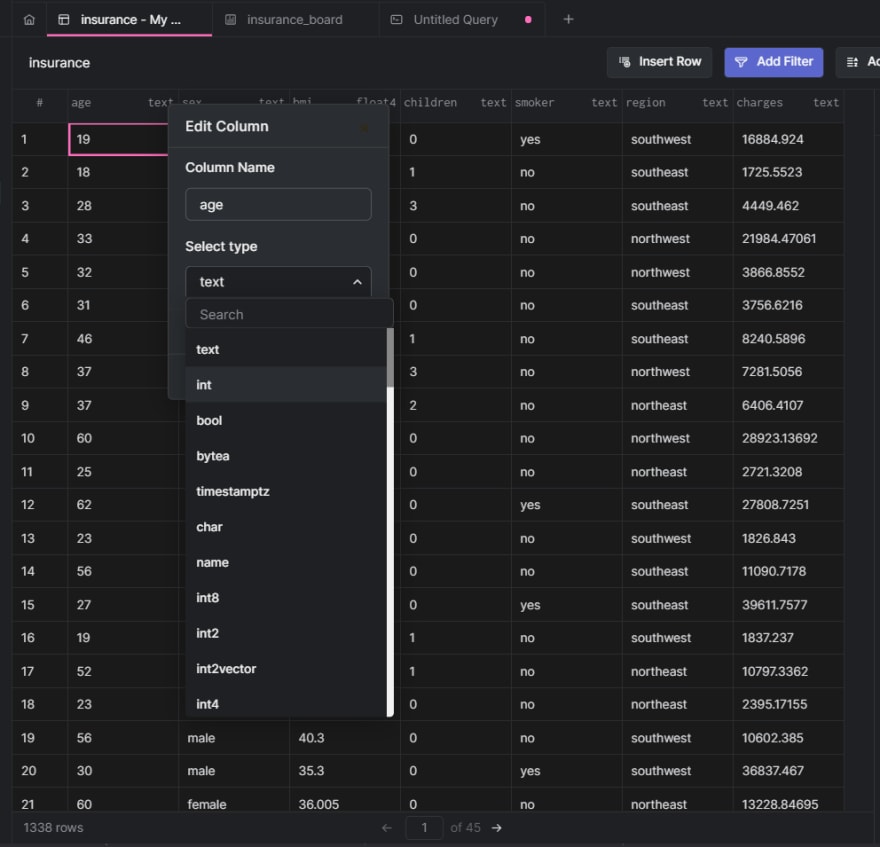
Visualizations help with understanding the nature and distribution of data in your database table. We can make a couple of charts and graphs before writing queries in PySpark to get a sense of the dataset we are working with. First, navigate to the column headers and change the type for the numeric columns, namely: age, bmi, and charges to int4, float4, and float4. This is done so you can interact with these columns as numbers and not strings.
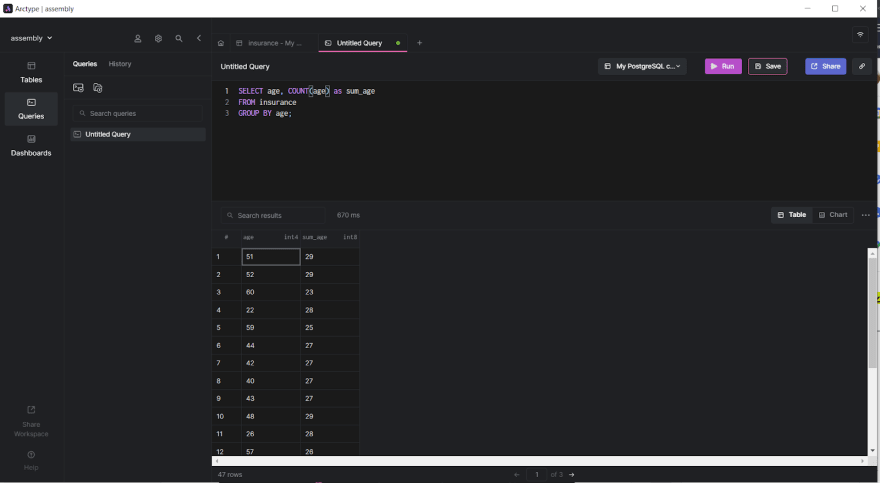
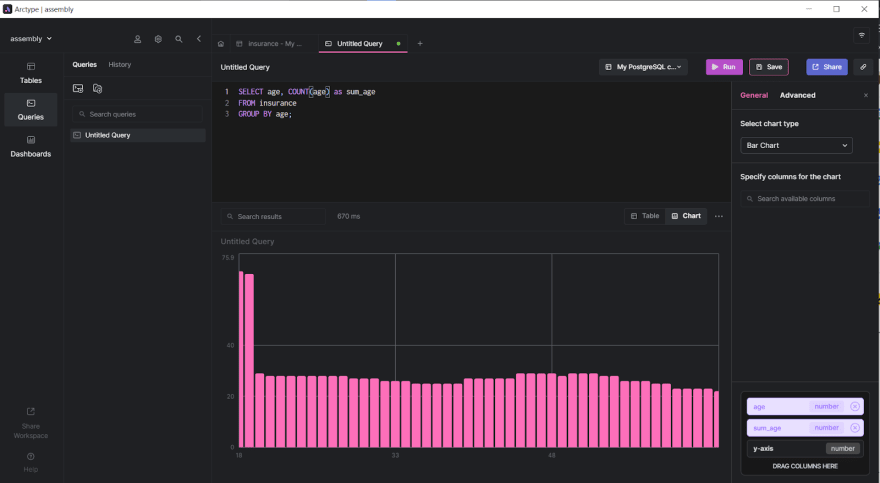
Once this is done, click the “Queries” option and create a new query by clicking on the first option in the now open queries pane. A file named “Untitled Query” is created. In this file, enter the following query to group the age column by unique ages and count their number of occurrences. Click “Run” to see the output in the output pane, as is shown below.
To generate a chart for visualization, click the Chart option on the output pane menu. A window gets opened to the right. Here, you can select “Bar Chart” as the chart type.
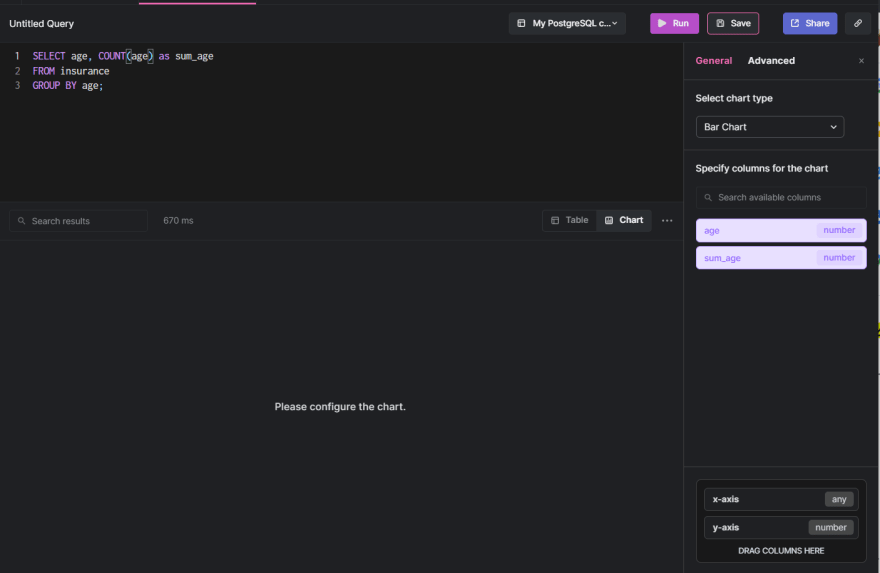
Next, drag down the age and sum_age columns to the x-axis and y-axis space on the bottom right. A bar chart is created and displayed, as shown below.
Setting up PySpark
To get started with PySpark, create a virtual environment and install pyspark from PyPI with pip, as shown below.
> python -m venv .venv
> pip install pyspark
Then, import SparkSession from pyspark.sql and create a session.
from pyspark.sql import SparkSession

 # function to create SparkSession

 spark = SparkSession.builder.appName("TrialApp.com").getOrCreate()
pyspark.sql is a Spark module for structured data processing in Python. It provides a programming abstraction called DataFrames and also plays the role of a distributed SQL query engine. .getOrCreate creates an existing SparkSession or, if there is no existing one, creates a new one with the options in this builder.
Installing Java 8
Spark does not support support Java versions later than 11. Use this link to download Java 8 if you don't have it already. You do not need to download the SDK; just the Java runtime environment will do. Check via your command line to ensure that you are on the right track.

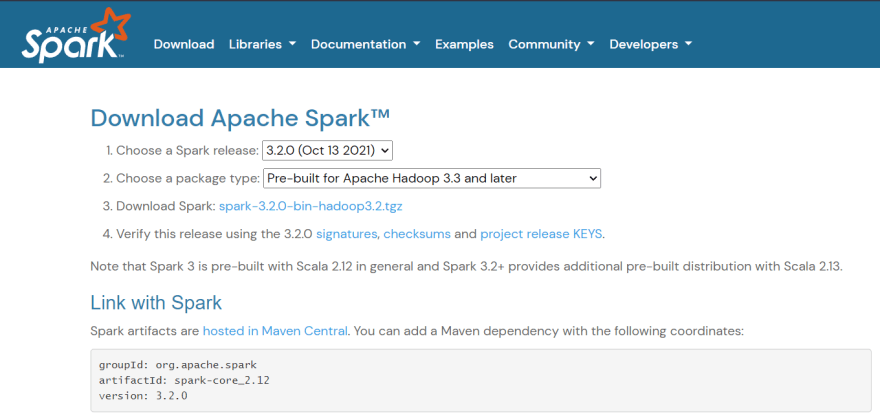
Then, download and install Spark. Click this link to download the spark installer. Make sure that you are downloading the most current non-preview version on the screen below.
Verifying the Spark software file
- Verify the downloaded file’s integrity by checking its checksum. This ensures that you are using an uncorrupted version and an unaltered version.
- As you see on item 4 in the image above, the checksum link can be opened. Navigate back to that page and click it.
- Next, in a command line, run the command below.
certutil -hashfile [path to spark download] SHA512

- Compare the code you see to that which you get from step 2. If they match, you are good to go.
Install Spark
Create a Spark directory in the root of your C: drive and extract the contents of the downloaded spark file into that directory. You will now have a directory with the path C:\Spark\spark-3.2.0-bin-hadoop3.2. Verify that the extracted files are in that specific directory and not a subfolder.
Next, access this link to download the latest PostgreSQL spark connector JAR files with their dependencies.

Save this file in the C:\Spark\spark-3.2.0-bin-hadoop3.2\jars directory.
Add the winutils.exe file
Create a folder still in the root folder of your C: drive named Hadoop. Then, click this repository link, identify the bin folder of your Spark installation Hadoop version, and download the winutils.exe file.

Create a folder named bin in the Hadoop directory and copy the winutils.exe file into it.
Configure environment variables
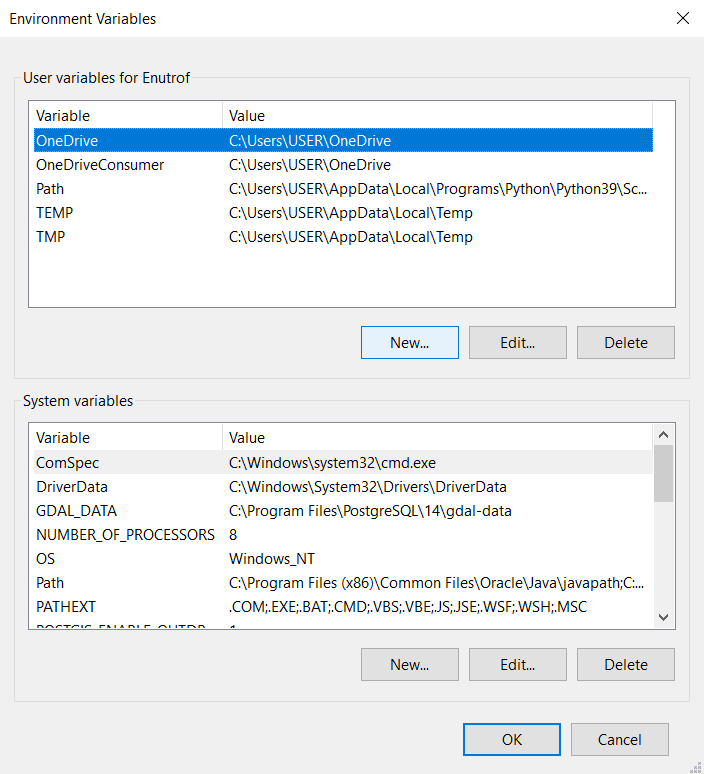
Next, we’ll add the Spark and Hadoop installation paths and bin folders to our system's environmental variables and PATH. Search for "environment" in your search bar and click the Edit the system environment variables option.
In the dialog box that appears, click Environment Variables and then New under User Variables in the window that appears.
Enter SPARK_HOME as the variable name and the path to the folder where you extracted the Spark files as your variable value type. For example: C:\Spark\spark-3.2.0-bin-hadoop3.2.

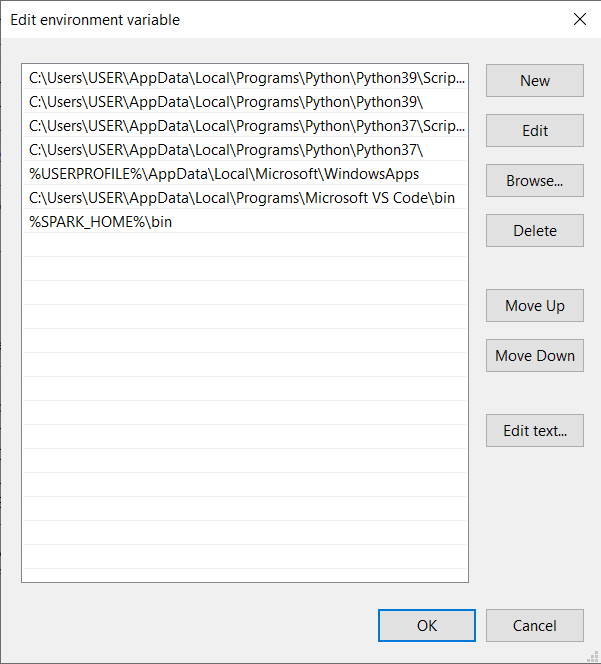
Click the Path variable and then edit it. A new dialogue box appears. Avoid deleting any entries already on the list.

In this dialogue box, towards the right, click the New button. The system creates and highlights a new line. Enter the path to the Spark folder's bin directory. Since you already created a variable, you can just enter %SPARK_HOME%\bin. The percentage sign serves the same purpose as curly braces in a Python f string. This has the additional effect of reducing the likelihood of errors in the path. Click OK.
Repeat this process for Hadoop with the following details:
- Variable name:
HADOOP_HOME - Variable value:
C:\Hadoop - Addition to path:
%HADOOP_HOME%\bin
And for Java with the following details:
- Variable name:
JAVA_HOME - Variable value:
C:\PROGRA~2\Java\jdk1.8.0_301
PROGRA~2 is a short form for Program Files(x86) and is used because the computer recognizes the occurrence of a space as the end of the path when you try to use PySpark.
Click OK to close all open windows.
Writing SQL queries in PySpark
Now, the next step is figuring out how to write SQL queries in PySpark. To get started, you need to connect PySpark with PostgreSQL.
Creating a SparkConnector for use with PostgreSQL
from pyspark.sql import SparkSession
spark = SparkSession.builder \
.appName("PySpark PostgreSQL") \
.config("spark.jars", "path\to\postgresql-42.3.1.jar") \
.getOrCreate()
# Read PostgreSQL DB table into dataframe
df = spark.read \
.format("jdbc") \
.option("url", "jdbc:postgresql://localhost:5432/analysis")\
.option("dbtable", "insurance") \
.option("user", "postgres") \
.option("password", "********") \
.option("driver", "org.postgresql.Driver") \
.load()
# Display database table schema
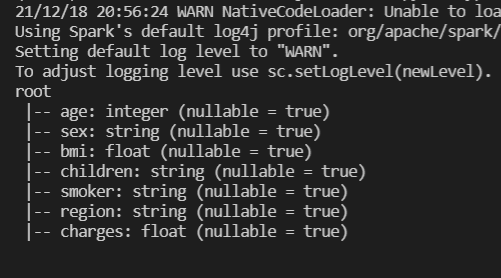
df.printSchema()
In the above code snippet, you first import SparkSession from pyspark.sql. Then, you create a Spark session. To do this, you call a series of methods on SparkSession.builder and pass in parameters.
-
.appNamemethod which takes in a string which represents an identifier for the app you are creating. - The
.configmethod which sets the location of the earlier downloaded postgresql jar file. - Finally, you call the
getorCreate()method to create the session or get it if it already exists.
With the spark session created, you move on to read the earlier created database table into a spark dataframe. To do this, we call the .read method on our earlier created session and set the format to “jdbc”. Following that, we have a series of options representing details like the url of the database, name of the database table, username, password and driver. After these options, we call the .load() method to create the dataframe.
Finally, we print the database schema to confirm that the connection was successful.
Selecting columns
df.createOrReplaceTempView("insurance_df")

df2 = spark.sql("SELECT AGE, SEX FROM insurance_df")
df2.show()
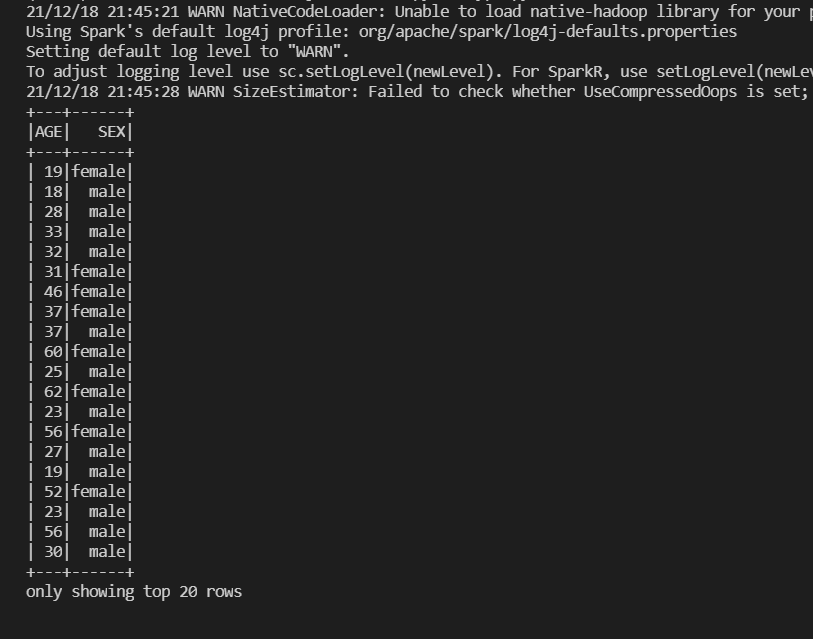
To select a column from the database table, we first need to make our dataframe accessible in our SQL queries. To do this, we call the df.createOrReplaceTempView method and set the temporary view name to insurance_df.
Next, we call the spark.sql method, enter the SQL query as a string: SELECT AGE, SEX FROM insurance_df and display the query results.
Outputting data using constraints
df3 = spark.sql("SELECT AGE, SEX FROM insurance_df\
                WHERE AGE>=18 AND SEX=='male'")
df3.show()
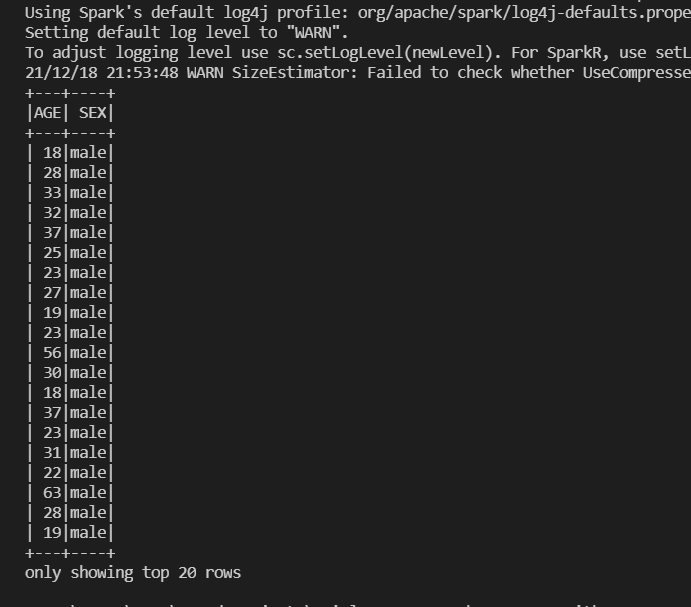
Now, you create a new data frame, and in this case, select the AGE and SEX columns for just the rows where AGE is greater than or equal to 18 and the SEX is male.
Outputting aggregated data using GROUP BY
df4 = spark.sql("SELECT AGE, COUNT(AGE) as COUNT_AGE\
                FROM insurance_df\
                GROUP BY AGE\
                ORDER BY AGE;")
df4.show()
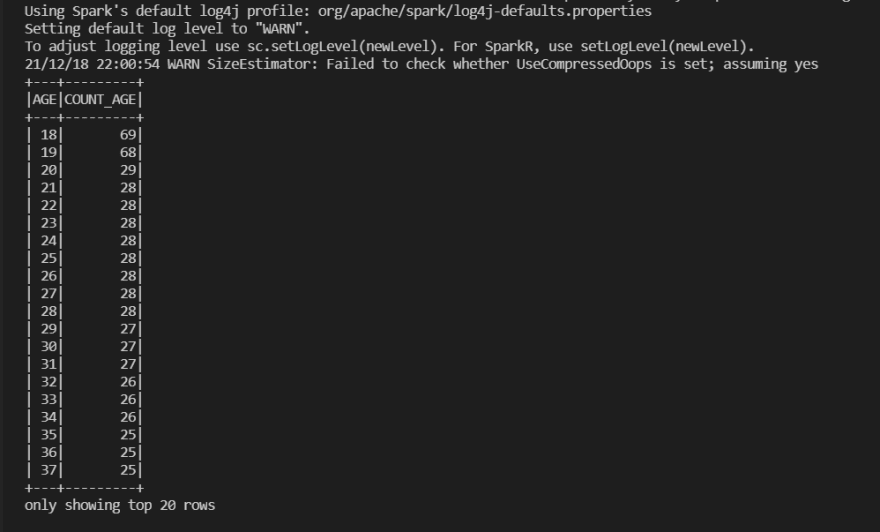
Next, we write a query similar to what we added when we visualized results on Arctype. Here, we group the table by age and count the entries for the unique ages. Then, we order by age in an ascending manner.
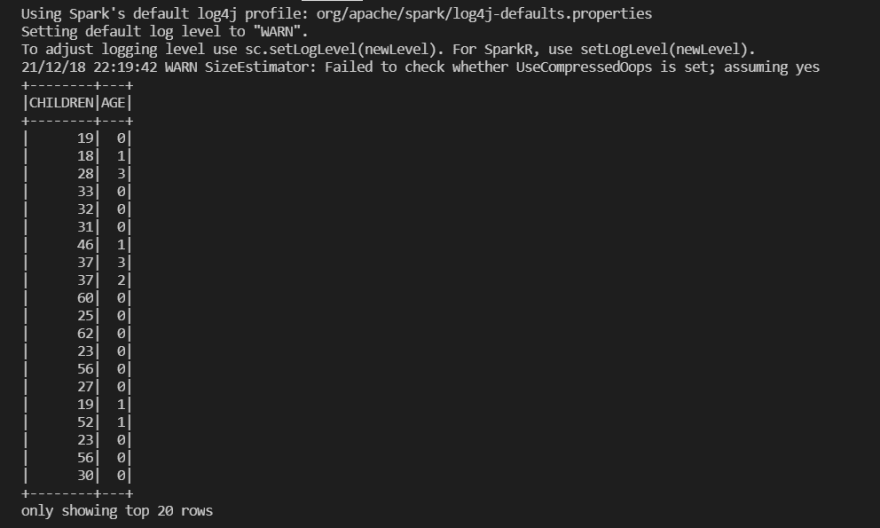
Switching the values of two columns in a table
df5 = spark.sql("SELECT AGE as CHILDREN, CHILDREN as AGE\
                FROM insurance_df")

df5.show()
In the query above, we simply select two columns from the insurance table and switch their column identifiers. By doing this, we have essentially changed the values that correspond to each column by doing this. The output can be seen below.
Conclusion
In this tutorial, you have learned about installing and setting up PostgreSQL, Arctype, and PySpark to achieve the goal of writing SQL queries in Python and visualizing the results of queries. This is particularly handy if you are working with very large datasets that will perform better using technologies like Spark.

Top comments (0)